U.S. interstates are populated with electronic displays that update drivers in real-time on traffic conditions, road closures, weather alerts and other important events. If there was a sign for executives steering our nation’s oil and gas producers, it would likely read “Poor Visibility, Slow Down Ahead.” After a short-lived price rally in Q1 2025, the industry faced lower commodity realizations and macroeconomic headwinds in Q2 2025, which spooked investors and hardened a cautious investment approach. In today’s RBN blog, we analyze the latest results of the 39 major U.S. E&P companies we cover and look at what’s ahead.

The NATGAS Appalachia weekly report provides the data and insights to monitor the northeast natural gas market’s twists and turns and identify the risks and opportunities along the way, including tracking supply-demand trends, outbound capacity and their impact on takeaway pipeline utilization, and regional prices.
After steady quarterly earnings declines since 2022, E&P profits rose 37% to $14.96/boe in Q1 2025, driven by a strong January crude oil spot price of $75.74/bbl and a 70% quarter-over-quarter growth in natural gas realizations. However, oil prices slipped to the $62-$63/bbl range in April and May before rising in June, while natural gas returns weakened throughout the quarter. Anticipating a negative impact on Q2 2025 results, the S&P E&P Index fell 15% in April to a four-year low and the energy sector generated the lowest overall Q2 2025 performance of any sector in the S&P 500.
Growing pessimism and uncertainty on the part of E&P managements was also reflected in the Q2 2025 survey of 91 oil and gas producers conducted by the Federal Reserve Bank of Dallas and published on July 2, just before the release of individual company results. The bank’s business activity index, the broadest measure of conditions faced by companies in a wide swath of the shale patch in Texas and New Mexico, turned negative for the first time since mid-2020. Executives cited heightened uncertainty from OPEC+’s unwinding of production cuts, trade and tariff changes, and escalating geopolitical tensions that are contributing to commodity price volatility and higher operating and capital costs. The survey indicated future production and investment would trend lower.
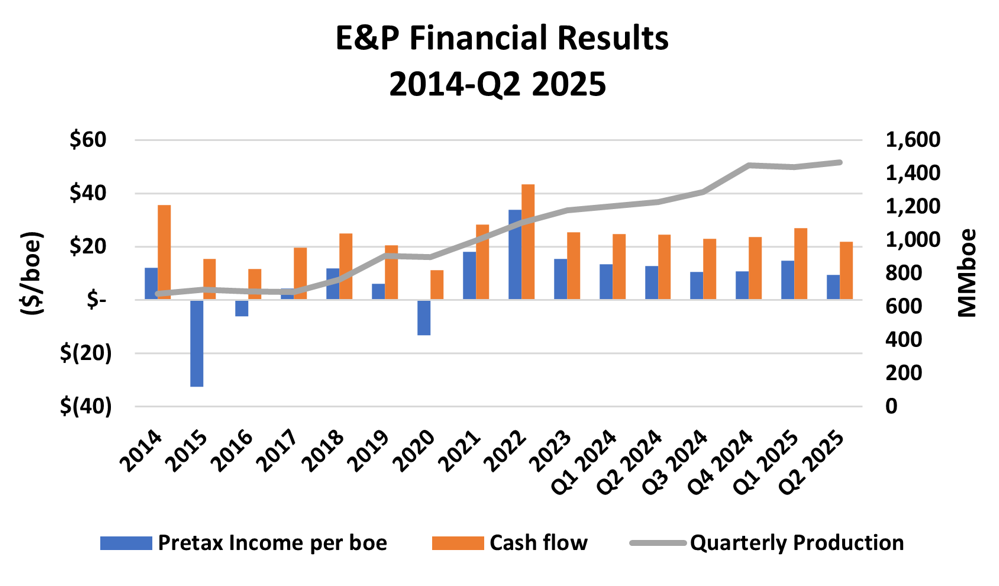
Figure 1. E&P Financial Results and Production, 2014-Q2 2025. Source: Oil & Gas Financial Analytics LLC
In upcoming blogs, we will analyze the cash-flow allocations and future production and investment forecasts disclosed in the midyear releases and conference calls. In today’s blog, we can report that the pessimism was certainly justified by the Q2 2025 financial results of the 39 E&Ps we cover. Pre-tax operating earnings fell 36% to $9.48/boe (blue bar at far right and left axis in Figure 1 above) and pre-tax operating cash flow (orange bar at far right and left axis) declined 19% to $21.74/boe. Realized prices were 14% lower at $33.03/boe, while total expenses were down 1% to $23.55/boe, led by a 2% decline in lifting costs. Impairment charges were down 5% but were mostly concentrated in the Oil-Weighted E&P peer group. DD&A expenses were up 2%, while exploration expenses increased 6%. Oil and gas production (gray line and right axis) was up 2% to 1.467 billion boe.
About the song
“Wrong Road Again” was written by Allen Reynolds and appears as the first song on side one of Crystal Gayle’s eponymous debut album. Released as the first single from the album in September 1974, it went to #6 on the Billboard Hot Country Singles chart. The song has been covered by Loretta Lynn (Gayle’s sister), Marianne Faithfull and Waylon Jennings. Personnel on the record were: Crystal Gayle (vocals), Allen Reynolds (rhythm guitar, backing vocals), Jimmy Colvard (lead, rhythm guitar), Lloyd Green (steel guitar, dobro), Joe Allen (bass), Buddy Spicher (fiddle), Charles Cochrane (keyboards, string arrangements), Bobby Wood (keyboards), Jimmy Isbell, Kenny Malone (drums, percussion), and Garth Fundis (baritone sax, backing vocals).
The album, Crystal Gayle, was recorded at Jack Clement Recording in Nashville and produced by Allen Reynolds. Released in February 1975, it went to #25 on the Billboard Country Albums chart. Three charting singles were released from the LP.
Crystal Gayle (Brenda Gail Webb) is an American country music singer. She started her professional career as a backup singer in her sister Loretta Lynn’s touring band. She signed her first record deal with Decca Records in 1970. She has released 25 studio albums, a live album, a soundtrack album, 17 compilation albums and 68 singles. She has won four ACM Awards, four American Music Awards, two CMA Awards, a Grammy Award, a Cliffie Stone Pioneer Award, is a member of the Grand Ole Opry, and has a star on the Hollywood Walk of Fame. Her last studio release was You Don't Know Me, an LP released in September 2019. Gayle still tours and will be appearing at various venues across the U.S. through November.