This year has seen the WTI discount to Brent trading in a range from $23/Bbl in February to less than $1/Bbl in July then back out to $19/Bbl in November. On Friday (December 27, 2013) the WTI discount to Brent was $11.85/Bbl. During the year the spread behaved differently in three distinct periods - reflecting changes in the fundamentals as well as market sentiment. Today we review how the granddaddy of crude spreads fared this year.
This is our year-end recap of the Brent versus WTI price relationship that is so influential in the crude oil marketplace because it provides a link between US and international markets. The two crudes are also the physical deliverables underlying the world’s biggest financial futures markets. As we shall see it has been quite a year for the “Spread” - as old hands call the difference in the price of these two crudes. But before we dive into complex relationship analysis (including how the spread was influenced by French disco super group Daft Punk) we’ll lay a little groundwork for members new to matters Spread.
WTI, the US domestic benchmark and Brent, the benchmark for crude sold in Europe, Africa and the Middle East are both light sweet crudes with similar refining qualities that should be priced about the same if they are trading in the same market. Historically that was the case, and WTI and Brent prices tracked closely - with WTI generally having a slight premium over its international rival – reflecting the freight cost to ship Brent to the US. A little over three years ago in August 2010, WTI began to trade at a discount to Brent because of a build up of crude inventory at the Midwest Cushing, OK trading hub. Growing crude production in North Dakota and Western Canada overwhelmed Midwest refinery needs and got caught in a Cushing glut because of inadequate pipeline transport capacity to Gulf Coast refineries. The WTI discount to Brent widened out as far as $28/Bbl in November 2011 and averaged $18/Bbl in 2012.
Which brings us to 2013 - a year that, looking back we can split into three distinct periods to document the Spread’s story, namely January to June, July to September and October to December. We’ll look at each of these in turn in a moment but first we should point out one more critical piece of the puzzle for 2013 – the fact that under Federal regulations dating back to the 1970’s, there are restrictions on the export of US crude to anywhere except Canada. For the past 10 years that hasn’t mattered much since the US imported most of its crude but in 2013 it began to count big time as US supplies started to overwhelm refining capacity at the Gulf Coast.
Brent Premium Collapses January to June 2013
The chart below shows the Spread relationship over 2013 with the first period of our analysis shadowed in gray. The chart has two axes. Plotted against the right axis are the Spread values – the Brent premium to WTI (green shaded area on the chart). Against the left axis are the absolute crude prices for Brent (blue line) and WTI (magenta line).
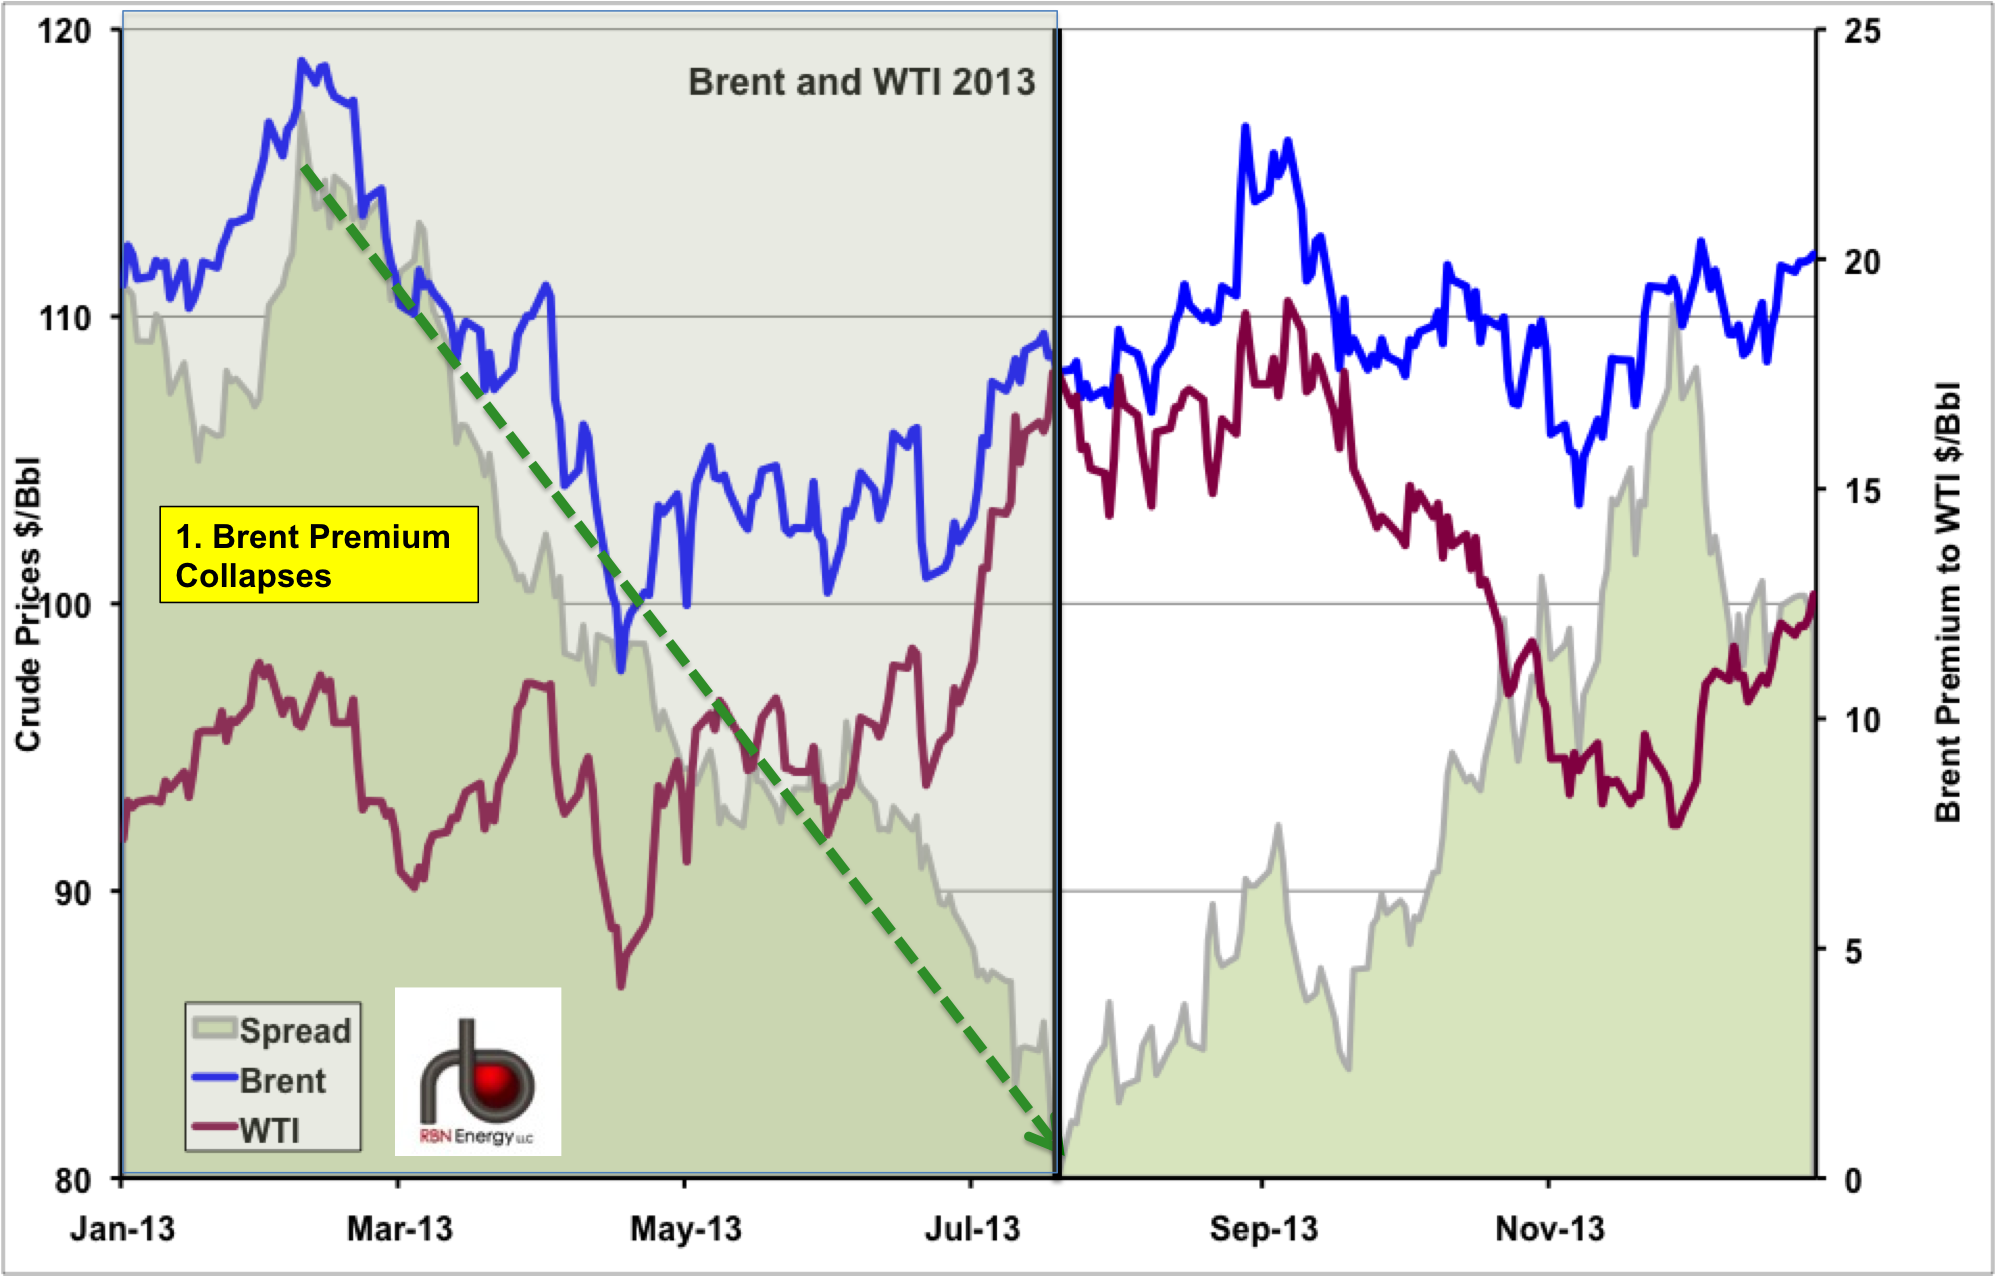
Source: CME data from Morningstar and RBN Energy
The first six months of 2013 were a transition period for the US crude market during which new pipeline capacity opened up between Cushing and Houston (Seaway Phase 2 expansion) and between the Permian Basin in West Texas and Houston (Longhorn Reversal). Crude-by-rail shipments also increased the flow of light sweet Bakken crude from North Dakota to the Gulf Coast. As a result more light sweet crude by-passed the Cushing logjam and reached Gulf Coast refineries - reducing the need for waterborne imports priced at international levels linked to Brent. As a result after rallying to its highest point of the year - $23/Bbl in February, the Brent premium to WTI fell by $22/Bbl to under $1/Bbl in July (green dashed arrow on the chart). Up until June the primary influence propelling the falling Spread was a $20/Bbl collapse in Brent prices that was not matched by WTI, which stayed relatively strong. Market sentiment seemed to believe that the existence of the new pipelines should relieve the downward pressure on WTI prices even though at that point the crude stockpile built up at Cushing during 2012 and early 2013 had not begun to decline significantly. In June however, an uptick in demand for light sweet crude in the Midwest pushed WTI prices up $12/Bbl relative to Brent. The crude stockpile in Cushing began to decline rapidly and Gulf Coast crude stocks began to increase. The net effect was that the Brent premium to WTI evaporated to less than $1/Bbl in early July (see Strangers in the Night).
Both Crudes Rally
The second period in our analysis is highlighted in pink on the chart below. Between July and September 2013 underlying Brent and WTI prices both rallied. Tensions in the Middle East and Brent production shortfalls due to maintenance kept international prices high while increased demand for WTI in the Midwest and falling stocks at Cushing underpinned WTI (see The Cushing Floodgates Open). Brent prices increased over $116/BBl and WTI over $110/Bbl by early September. The Brent premium to WTI widened out again during this period to $5/Bbl but remained in a relatively narrow range with the two crudes tracking roughly the same path.
About the song
The Daft Punk single “Get Lucky” was probably 2013’s biggest megahit – (certainly by a French duo)