It’s the 10-year anniversary of a polar vortex winter that’s seared into the memories of every propaner who lived through it. Shortages. High prices. Government inquiries. Sure, there were difficulties during that winter in the markets for natural gas and fuel oil too, but it was particularly bad for propane. It seemed like a perfect storm hit the propane market right where it hurt the most — in the heart of propane country: the Upper Midwest and the Northeast. A lot has changed since then, but it’s important to look back at what went wrong, what’s been done to make a repeat of that chaotic winter far less likely, and what those events still mean for the propane market today.
The propane market conditions that cascaded into the chaos of 2013-14 started innocently enough, with rain — lots of it. In the fall of 2013, propane marketers were enjoying 5X the usual seasonal demand from the market for drying crops, especially corn. As we documented in Farmer Dries Corn And I Do Care, posted on November 10, 2013, the Midwest was enjoying the largest bumper crop of corn in the record books up to that time, and due to the very rainy conditions before the harvest, the “wet” corn needed a lot more drying than usual. But that’s not all that was going on. One of the historical conduits for propane into the Midwest from Western Canada, the Cochin Pipeline, was being reversed and converted by Kinder Morgan, the operator in those days — the pipe’s now owned by Pembina — from propane to diluent service so natural gasoline and naphtha could be moved up to Alberta. At the same time, propane exports from the Gulf Coast were ramping up, pulling more supplies that otherwise would have gone to the Midwest down to supply the export market. By October 1, the price of propane in Conway, KS — the primary hub for Midwest and Midcontinent supplies — had increased to $1/gallon, up from about $0.85/gallon during the summer. [Note that in this blog we are going to focus on the Midwest propane market, which felt the most significant impact that winter, but similar developments were happening in the Northeast and to a lesser extent in the Southeast and Gulf Coast.]
Regional inventories were drawn down by the extraordinary crop-drying demand. Then, the worst possible scenario: It got cold, and bitterly so. In the first few days of December, over 100 daily snowfall records were broken across the U.S. The temperature in Jordan, MT, crashed to −42 °F on December 7. Conway propane prices ramped up to $1.20/gallon and it looked like even higher prices were on the way. Meteorologists blamed the cold on something called the “polar vortex” — for most of us weather novices back in those days it was a new term describing a rotating artic airflow pattern that had shifted the flow of frigid air much further south than usual. Before you knew it, the media picked up the term as a great way to strike fear into the hearts of everyone subject to the frigid conditions. (Fear pumps up Weather Channel viewership like air pumps up inflatable Santa Clauses.)
And for the next few weeks, the sustained cold kept on coming, which meant that the propane supply chain never had the opportunity to catch up. Local market stocks at bulk plants were drained. Rail supplies were depleted. Propane retailers were forced to send their trucks to far-away locations to secure supplies. Conway propane ended 2013 at $1.45/gallon.
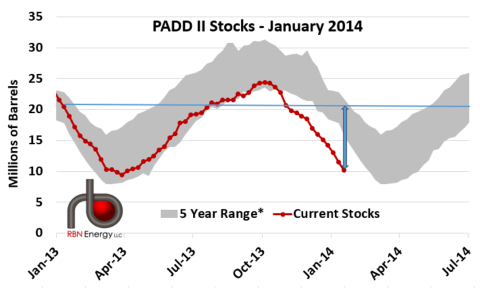
As shown in Figure 1, by January 17, 2014, it was easy to see what was going on in Energy Information Administration (EIA) stats. PADD II (Midwest) inventories were down to 10.2 MMbbl (right end of blue line), which was 11.6 MMbbl below the same week in 2013 (horizontal blue line and vertical blue arrow) and about 6 MMbbl below the bottom of the five-year range (gray-shaded area). If the decline continued at that rate, it looked like stocks could be depleted by the end of the season. Conway propane ratcheted up to $1.73/gallon.
Figure 1. PADD II Propane Stocks, 2013-14. Source: EIA
Join Backstage Pass to Read Full Article


