The tide is shifting in the energy sector back toward hydrocarbons as renewables face new, big hurdles. The latest tangible sign of this shift is BP’s decision to refocus on traditional oil and gas and deemphasize renewables, which follows ExxonMobil’s and Shell’s restructuring of strategies in the same direction. The likelihood that hydrocarbon demand will continue to grow throughout this decade has reinforced the importance of E&P companies adding to their proved oil and gas reserves. In today’s RBN blog, we analyze crucial trends from the 2024 reserve reporting of the major U.S. oil and gas producers.
First, let’s define oil and gas reserves and review how producers report them. As we explained in Replace Me, proved reserves are quantities of crude oil, natural gas and NGLs assumed to have at least a 90% chance of eventual recovery under existing economic and operating conditions. Oil and gas companies must report their proved reserves annually in their 10-Ks. The changes result from four primary factors:
- Extensions and Discoveries, the most impactful, are reserves unlocked through the development of existing fields and the successful exploration of new properties. These additions are funded by the company’s annual organic or finding and development (F&D) capital spending. The level and effectiveness of this investment are critical to the long-term sustainability of an E&P.
- Revisions of previous estimates primarily result from changes in commodity prices — lower prices can make specific volumes uneconomic to produce, while higher realizations nudge volumes into the proved category. Poor well performance can also reduce estimates of future recoverable volumes from a field.
- Purchases and Divestitures reflect the net result of M&A activity.
- Production Volumes are subtracted from beginning-of-year reserves and current-year reserve additions to arrive at current year-end reserves.
The key measures of the quality and long-term sustainability of a company’s acreage are the costs incurred in organically replacing reserves through extensions and discoveries — see the first bullet above. These include development activities, such as drilling and completing wells, adding infrastructure such as roads and processing facilities, water handling and disposal, and other expenses. They also include exploration costs for finding new oil and gas reserves. What producers call the F&D replacement rate is calculated by dividing their total organic reserve additions by their total production. F&D costs are calculated by dividing the total development-and-exploration costs by the volume of organic reserve additions.
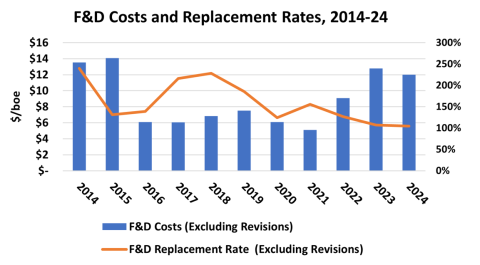
As shown in Figure 1 below, F&D replacement rates (orange line and right axis) have declined from a high of 228% in 2018 to just under 100% in 2024. The steep fall from the peak resulted from cutbacks in organic capital investment as oil prices plummeted in late 2019 and cratered with the onset of the pandemic in early 2020. The rate temporarily rose on catch-up activity in 2021 but has fallen since. At the same time, F&D costs (blue bars and left axis) doubled in 2023-24 from the $6/boe range in 2016-21.
Figure 1. F&D Costs and Replacement Rates, 2014-24.
Source: Oil & Gas Financial Analytics LLC
Join Backstage Pass to Read Full Article


