U.S. LNG was poised for a year of massive growth in 2024, with new terminals and expansions set to cause feedgas to rise and commercial success in the years following Russia’s 2022 invasion of Ukraine set to spur further LNG project development. Instead, construction delays have pushed projects back and feedgas in the past three months has averaged about 500 MMcf/d less than the same period last year. Meanwhile, the Biden administration’s pause on non-free trade (FTA) export licenses, lengthy delays to the Federal Energy Regulatory Commission (FERC) authorization process and the resulting legal challenges to both have brought project development to a near-standstill. In today’s RBN blog, we look at current U.S. LNG feedgas demand and how construction delays have shifted expectations for the next few years.
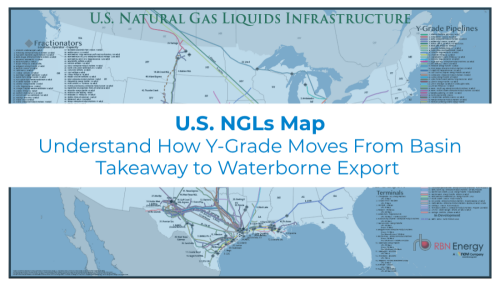
Visualize the infrastructure behind U.S. NGL movement.
The U.S. NGLs Map provides a comprehensive view of the transport, processing, and export networks moving NGLs across the U.S.
With just days left in 2024, U.S. LNG feedgas demand has averaged 12.53 Bcf/d, and while that is a tremendous amount of demand, it’s just under the 2023 average. This will be the first year since the U.S. began exporting LNG in 2016 that feedgas demand did not grow — and yes, that includes 2020 and the COVID-related markets crash that collapsed LNG demand. (Even with massive cargo cancellations in the summer of 2020, demand still grew by nearly 1.5 Bcf/d year on year.) The reason for this year’s drop is that the primary driver for LNG feedgas demand is not the current market, it’s LNG export demand capacity. While market conditions here and abroad can impact feedgas demand — incentivizing terminals to produce extra peak cargoes when market conditions warrant and schedule maintenance or slightly slow production when they don’t — LNG terminals are underpinned by long-term, take-or-pay contracts, a heavy incentive to keep producing no matter what. Only during the peak of the global markets crash in 2020 have U.S. LNG economics been poor enough to see widespread cargo cancellations. As a consequence, feedgas demand has grown with export capacity.
For more on the LNG market, check out the newly updated version of LNG Voyager, our weekly report on the industry. The revised edition includes expanded coverage, streamlined analysis and an enhanced layout that improve the report’s appearance and usability.
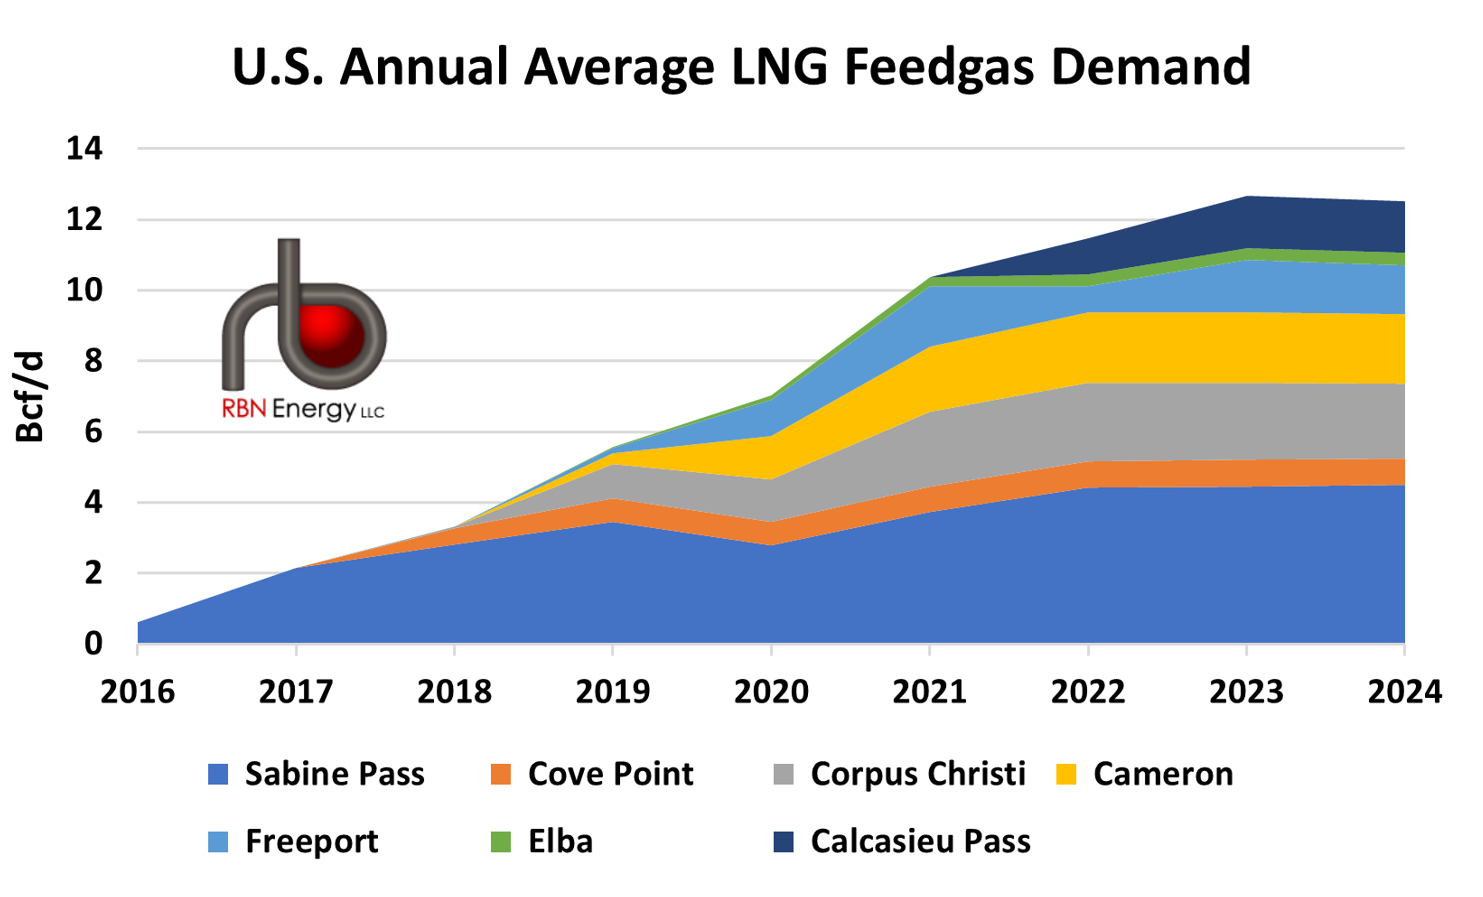
Figure 1. U.S. Annual Average LNG Feedgas Demand by Terminal. Source. RBN, Wood Mackenzie
As Figure 1 above shows, when each new terminal has come online feedgas demand has grown. The year-on-year growth in 2020 was exclusively from new LNG trains coming online, which caused feedgas to ramp up at Corpus Christi, Cameron, Freeport and Elba that year, while feedgas demand from Sabine Pass and Cove Point, where no new trains came online or were commissioning, were down that year. But no new trains or terminals have come online since 2022. Calcasieu Pass LNG began taking feedgas in late 2021 and by September 2022 was taking in feedgas at a level consistent with full utilization at the terminal. The terminal is still technically commissioning but has been producing LNG at a level consistent with full utilization since the end of 2022. (For more on the terminal’s lengthy commissioning and ongoing dispute with its offtakers, see our Analyst Insight.) While no new trains came online in 2023, the combination of Calcasieu Pass at full operations for the year and the return of Freeport to full service after being offline for more than seven months following an explosion at the terminal in June 2022 (see Shut Down) led to 1.2 Bcf/d of feedgas demand growth from 2022 to 2023.
About the song
“Tired of Waiting for You” was written by Ray Davies and appears as the sixth song on side one of The Kinks’ second studio album, Kinda Kinks. Released as a single in February 1965, it went to #6 on the Billboard Hot 100 Singles chart. According to Ray Davies, the song was written on a train to the recording studio, with the lyrics finished on a tea break. Dave Davies considers the song “a perfect pop record.” Personnel on the record were: Ray Davies (lead vocals, rhythm guitar), Dave Davies (lead guitar, backing vocals), Pete Quaife (bass) and Bobby Graham (drums).
Kinda Kinks was recorded at Pye and IBC Studios in London from August 1964 to February 1965. Produced by Shel Talmy, the album was released in March 1965 and went to #60 on the Billboard 200 and #3 on the UK Album charts. One single was released from the LP.
The Kinks were a British rock band formed in London in 1963 by brothers Ray and Dave Davies. They are regarded as one of the most influential rock bands of the 1960s. With the release of their third single, “You Really Got Me,” in August 1964, they received international recognition. The distorted power chords of Dave Davies in the song separated the sound of The Kinks from other British rock bands of the time. They released 26 studio albums, six live albums, 34 compilation albums, 10 EPs and 78 singles and have sold more than 50 million records worldwide. The band has received the Ivor Novello Award for “Outstanding Service to British Music” and was inducted into the Rock and Roll Hall of Fame in 1990 and the U.K. Music Hall of Fame in 2005. Twelve members have passed through the group since its formation. The band broke up for what appears to be the final time in 1996, although rumors of the Davies brothers reuniting with The Kinks are a common occurrence. Ray and Dave Davies continue to have successful solo careers.