There’s been a lot of speculation about whether the pace of electric vehicle (EV) adoption has slowed, with JD Power now expecting EVs to make up 9% of U.S. new-car sales in 2024, down from its earlier estimate of 12.4% but still up from 7% in 2023. The group remains bullish on EVs in the long term, expecting market share to reach 36% by 2030 and 58% by 2035. The forecast from RBN’s Refined Fuels Analytics (RFA) group forecast has been — and continues to be — more conservative than most but still anticipates EVs will reach 50% of U.S. new-car sales by the early 2040s. In today’s RBN blog, we’ll look at what drives these forecasts and the anticipated impacts on gasoline demand.
In observance of Veterans Day, we’ve given our writers a break and are revisiting a recently published blog on EVs and gasoline demand. If you didn’t read it then, this is your opportunity to see what you missed! And to our vets, thank you for your service.

The Future of Fuels bi-annual report by RBN's Refined Fuels Analytics provides an in-depth analysis of the U.S. and global refinery industries, focusing on crude oil and fuel market dynamics, supply and demand, alternative fuels, refinery capacities, and price forecasts to help stakeholders navigate the evolving energy landscape.
RFA’s forecasts for EV sales growth (dark-blue bars in Figure 1 below), which were part of its latest Future of Fuels report published in July, are dwarfed by those from other groups, notably JD Power and the International Energy Agency (IEA). The IEA’s most recent report, from April 2024, put U.S. EV sales at 1.4 million in 2023, 17% higher than RFA’s own estimate of 1.2 million. However, the IEA expects U.S. EV sales to reach 9.5 million by 2030 in its Stated Policies scenario (orange bars), 3X the RFA estimate. Its Announced Pledges scenario (green bars), which assumes all climate-related goals will be met, forecasts slightly higher EV sales. The Energy Information Administration (EIA) has not released a new EV sales forecast since its 2023 Annual Energy Outlook (AEO; light-blue bars) but was relatively bearish on EV sales in that report, expecting sales to grow to only 2.3 million by 2030. (The EIA chose not to publish an AEO in 2024 as it updates its models.) Evadoption.com (purple bars), which provides a free EV sales forecast, expects U.S. EV sales to reach 4.7 million by 2030. Figure 1 below illustrates the differences in these forecasts. (For reference, annual total domestic new vehicles sales averaged 16.6 million for the 10-year period between 2014-23.)
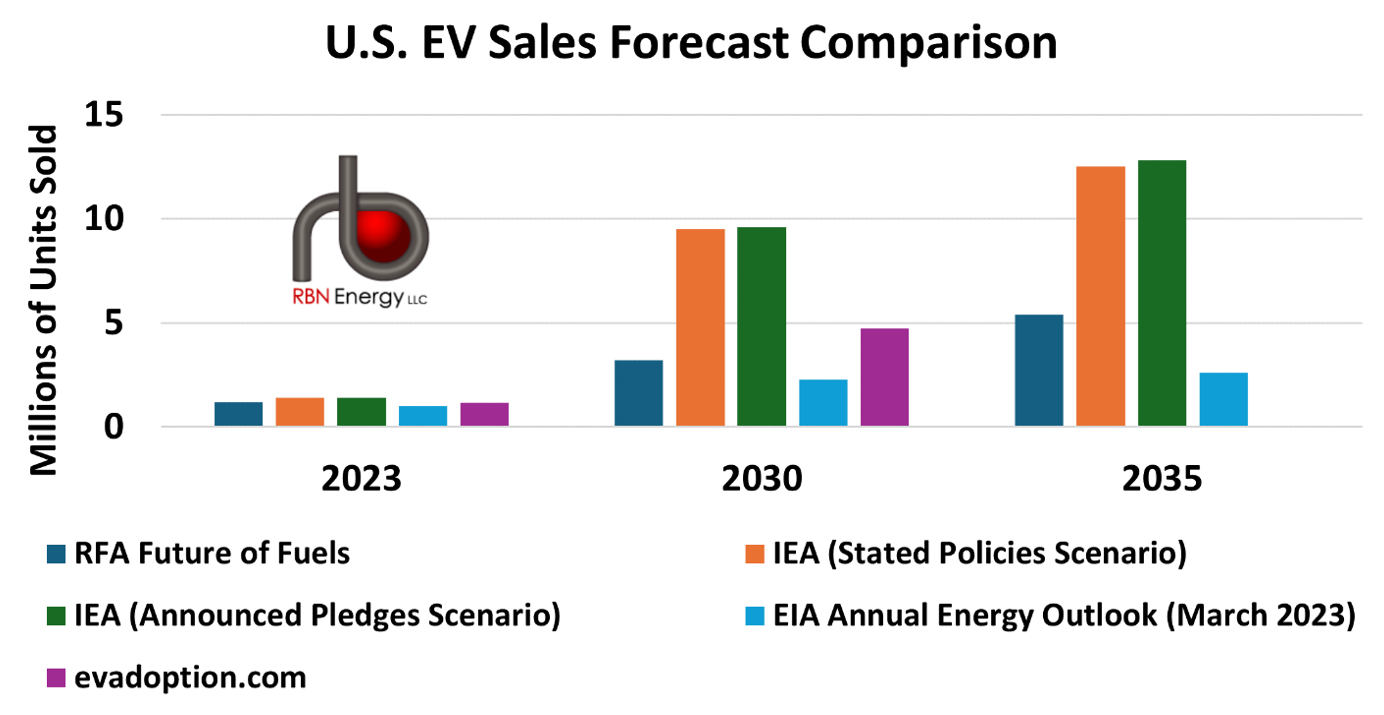
Figure 1. U.S. Sales Forecast Comparison. Source: Refined Fuels Analytics

About the song
“The Long Road” was written by Eddie Vedder and appears as the B-side of Pearl Jam’s 1995 EP, Merkin Ball, which was released as a companion to Neil Young’s 1995 album, Mirror Ball. Young plays and sings on the two-song EP. Recorded in February 1995 at Bad Animal studio in Seattle, it was produced by Brett Eliason. Released in December 1995, it went to #2 on the Billboard Mainstream Rock and #7 on the Billboard Hot 100 Singles charts. It has been certified Gold by the Recording Industry Association of America. The song was used in the motion pictures Dead Man Walking, Outsourced, and Eat Pray Love and was used in an episode of the sitcom Scrubs. Personnel on the record were: Eddie Vedder (vocal, guitar), Neil Young (guitar, pump organ, backing vocals), Jeff Ament (bass), and Jack Irons (drums, percussion).
Pearl Jam is an American rock band formed in Seattle in 1990. After the demise of Stone Goddard and Jeff Ament’s bands, Green River, and then Mother Love Bone, the two recruited Mike McCready, Eddie Vedder and Dave Krusen to form a new group called Mookie Blaylock. After signing with Epic Record in 1990, the group changed its name to Pearl Jam. They have released 12 studio albums, 23 live albums, three compilation albums, one EP, and 46 singles. They have sold more than 85 million records worldwide. They have received five American Music Awards, two Grammy Awards, and four MTV Video Music Awards. They were inducted into the Rock and Roll Hall of Fame in 2017. Nine members have passed through the band since its inception. The lineup of Vedder, Gossard, McCready, Ament, and Cameron has been constant since 1998. They continue to record and are currently on their Pearl Jam 2024 Tour.