Is the winter of 2012/13 all over - bar the shouting? With the end of the heating season just nine weeks away (March 31, 2013) there may not be enough time left for winter temperatures to have a material impact on record natural gas storage levels. Today we analyze where the winter could go from here.
Let’s talk about weather today. Not in the form of, ‘It sure is cold out there, isn’t it?’ but rather on a level more attuned to the RBN mission. Let’s talk about weather and the impact it can have on natural gas storage levels and prices.
Two weeks ago several natural gas analysts declared that winter had come to an early end. One flatly stated, ‘winter is done for.’ Other analysts on various chat boards appeared to agree. Yet last week the nation saw bitterly cold temperatures in the northeast accompanied by significant snowfall. With nine weeks remaining in the heating season the dire analyst predictions seem premature, but let’s see if they are plausible.
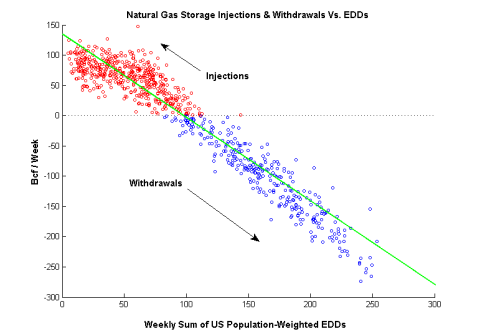
Weather has an outsize effect on the amount of natural gas that is withdrawn from, or injected into storage. The chart below that shows weekly natural gas storage injections and withdrawals versus a measure of national average temperatures illustrates how that happens.
(Click to Enlarge)
In the chart national temperatures are represented as EDDs (Energy Degree Days) summed over a week. We’ll re-visit the topic of EDDs in a later blog, but for now just know that EDDs represent absolute temperatures referenced to a baseline of 65 degrees Fahrenheit. For example, if it’s 25 degrees outside, you are living a 40 EDD day. And if it’s 75 degrees outside, you’re having a 10 EDD day. Mathematically, an EDD is equal to the absolute value of a day’s average temperature (“Tavg”) minus the baseline of 65 degrees: that is,
EDD = | Tavg – 65|.
And if you are more familiar with heating degree days (HDDs) and cooling degree days (CDDs), an EDD is just the sum of the two (see Under the Weather for more on HDDs and CDDs).
Working from left to right on the chart - in weeks that have 0 EDDs (meaning those weeks that are a comfortable 65 degrees outside throughout the week) we generally don’t consume a lot of natural gas for heating or cooling. We instead inject gas into storage. Moving all the way to the right, on a 250 EDD week, meaning that across the nation temperatures have averaged 29 degrees all week, we tend to withdrawal a lot of gas from storage. So depending on how cold it’s been, we’ll withdraw anywhere from 0 Bcf/week to 250 Bcf/week during winter months. That is a lot of variability, which helps keep the gas market interesting.
Obviously weather is the single biggest factor impacting storage levels. And there’s no doubt that traders watch storage levels, driving prices up when storage levels get too low and driving prices down when storage levels get too high. In short, weather has an indirect effect on natural gas prices. Of course, this comes as old news to loyal RBN readers. But to better understand the relationship, let’s take a look at it graphically.
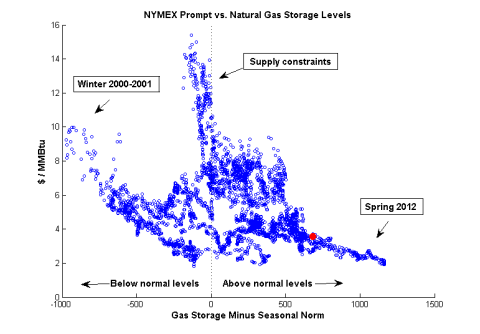
In the chart below storage levels are shown on the x-axis, and prompt NYMEX natural gas futures prices on the y-axis. The storage numbers presented here are not absolute levels but rather deviation of levels from normal, where normal is the mean storage level across a multi-year timeframe.
(Click to Enlarge)
If the chart seems to contain a lot of dots for weekly storage data, well, it does. We’ve taken the weekly storage levels and interpolated them to daily. That allows us to use all of the prompt prices, and makes the computation of normal levels much simpler. This data set goes all the way back to January 2000 so there are about 3,300 data points in the chart (there are no weekend prices). The big red dot denotes the current storage level and prompt price.
Let’s examine this weird, amoeba shaped graphic. Basically we have three arms – right, left and vertical. The right hand arm indicates that we have too much gas in storage. Prices are low, and the storage balance is well above normal. The left hand arm indicates that storage balances are below normal. Prices are generally higher, though not always. The vertical arm mostly represents that period in 2008 when supply constraints and general commodity market exuberance spiked prices into the teens.
Note that our big red dot is out on the arm that indicates we have too much gas in storage. This is why some analysts are lamenting an early end of winter. Can the market correct itself before summer returns? Well, with just nine weeks of winter left, only so much can happen. Restated, time is running short. The following graphic presents total EDDs for years past, for the time frame 1/28 through 3/31 – what is left of this winter.
(Click to Enlarge)
There are 63 days left in the season, and from the above graphic we average 1,350 total EDDs over those days. That works out to an average of 21 EDDs per day (which means an average temperature of 44 degrees) for the rest of the storage withdrawal season. Thus there are likely cold days ahead of us, but perhaps not enough to materially impact the current storage surplus.
Let’s consider what would happen to the March 31st, 2013 storage level if the remaining nine weeks behaved like those same nine weeks of years past.
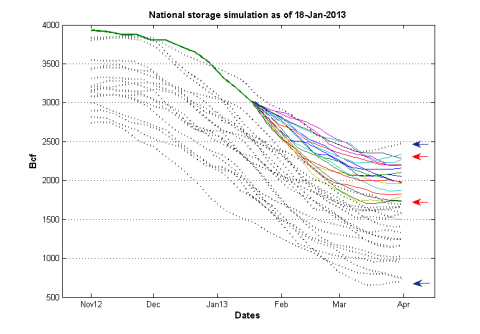
In this final chart, dotted grey lines represent storage level histories from years past. The heavy green line shows the 2012-13 storage levels to date.
And finally, the multi-colored lines simulate storage levels for the remaining 2012-13 withdrawal season. We call these multi-colored lines storage trajectories. To obtain these trajectories, we’ve started with the most recent EIA weekly storage report and shifted past year’s levels to this year’s starting point.
(Click to Enlarge)
It’s important to recognize that the trajectories represent what this season’s storage levels would look like if the market conditions of past years repeated themselves from now until the end of March. In other words, starting from where we are today, the multi-colored storage trajectories show the range of end-of-season balances should the rest of the winter follow the pattern of the previous winter trajectories from this point forward.
Historically, the actual March 31st levels (from the dotted lines) span a range of 600 – 2,500 Bcf (the blue arrows). In contrast, our simulated levels span a range of just 1,700 Bcf to 2,400 Bcf (the red arrows). The latter range is much smaller than the former, illustrating again that there’s just not much time left in the season for a lot of variability. If the weather were to repeat the coldest season-ending months from our 15 year sample we would only get down to 1,700 Bcf/d. If this year ends like several of the warmer season-ending months, we’ll be closer to 2,400 bdf. Consequently our simulated March 31st levels are roughly 400 – 1,100 Bcf above normal.
If we look back to our second graphic, when storage levels are 400 – 1,100 Bcf above normal, prompt prices are all over the board. Sadly the relationships shown in this analysis don’t help much in our ability to predict the prompt price of natural gas this spring. But, we can infer two things about the remaining nine weeks of winter:
- Odds are that there is only 700 Bcf of variability left in the March 31st storage level.
- Storage levels are likely to end the season with high balances again this spring.
So it doesn’t look so good for gas prices. Maybe it is the end of winter as we know it (and now I don’t feel so fine).
|
Each business day RBN Energy releases the Daily Energy Post covering some aspect of energy market dynamics. Receive the morning RBN Energy email by signing up for the RBN Energy Network. |
It’s the End of the World as We Know It (And I Feel Fine) was written by R.E.M. in 1987. The song was first released as a single and subsequently in the album Document. Following the Sept. 11, 2001 terrorist attacks Clear Channel included this song on a list of 165 songs deemed lyrically questionable to its 1,200 radio stations (meaning, don’t play these). One could, however, argue that it is today’s blog that is lyrically questionable.


