Earlier this week (see Spring, Spring, Spring is in the Air) we looked at the US natural gas supply demand picture. Our analysis focused on the 25 percent run up in NYMEX natural gas futures prices to $4/MMBtu this year (they have since slipped back to close yesterday at $3.90/MMBtu). Prices rose because high winter demand helped demolish a huge gas storage surplus that hung over the market and depressed prices since last spring. The market should not forget however that for a time last year – with prices below $2/MMBtu and Lower 48 dry gas production through the roof - there was talk of hitting the “storage wall”. A sharp increase in power burn soaked up 6 Bcf/d of natural gas last summer and helped the market out of that scrape.
Despite all the market optimism about $4/MMBtu prices, the big question mark this year has to be where incremental natural gas demand will come from once temperatures warm up? The reason we need to answer that question is because US Lower 48 dry natural gas production is still booming along at close to record levels around 64 Bcf/d. Even if production does not increase much this year – that is still a lot of gas. Heating demand did a good job of soaking up surplus gas this winter but it wont help once winter is over. It is worth comparing for a minute where we are today with the situation a year ago, coming out of the “non winter” of 2011-2012.
Last year (April 2012) gas storage finished winter at record levels and commentators were talking seriously about hitting the “storage wall” (see The Wall). The storage wall occurs in theory when natural gas storage gets filled to the brim. (We say in theory because nobody knows when it will happen – because it never has.) The threat of the storage wall helped cause natural gas prices to collapse below $2/MMBtu. As it turned out the storage wall was headed off at the pass by an unprecedented increase in power burn – the use of natural gas for electric power generation. US total power burn between April 1 and July 31was about 720 Bcf higher in 2012 than over the same period in 2011 – an increase of close to 6 Bcf/d in demand (source: Bentek Cell Model). Most analysts attributed the increased power burn to generators switching between coal and gas for power generation because gas was considerably cheaper.
So far in 2013 the power burn numbers do not look nearly so strong. The Bentek Cell Model data that we reviewed on Monday (see Spring, Spring, Spring is in the Air) showed about 10 percent less natural gas consumption for power burn in 1Q 2013 than last year. If the same economics of coal to gas switching apply this year as last then it follows that doubling the price of natural gas from $2/MMBtu to $4/MMBtu would discourage generators from using natural gas instead of coal. That is just one school of thought however and many analysts disagree with this “black and white” approach to natural gas power burn and say that high levels of gas power burn are “here to stay” – even at $4/MMBtu.
To try and improve our understanding of this complex topic we’ll revisit the analysis we did last year on the economics of power switching between coal and natural gas. Back then we looked at the comparative costs of generation to understand when power system operators might use gas fired plants instead of coal and vice versa (see Talking ‘Bout My Generation). The theory behind our analysis is called “economic dispatch” and it dictates that once certain priorities have been attended to such as system safety and reliability, the order of generation plant dispatch is governed primarily by fuel cost. Coal to gas fuel switching requires power system operators to use natural gas instead of coal when they have a choice of units to meet power load. That fuel switching increases natural gas power burn.
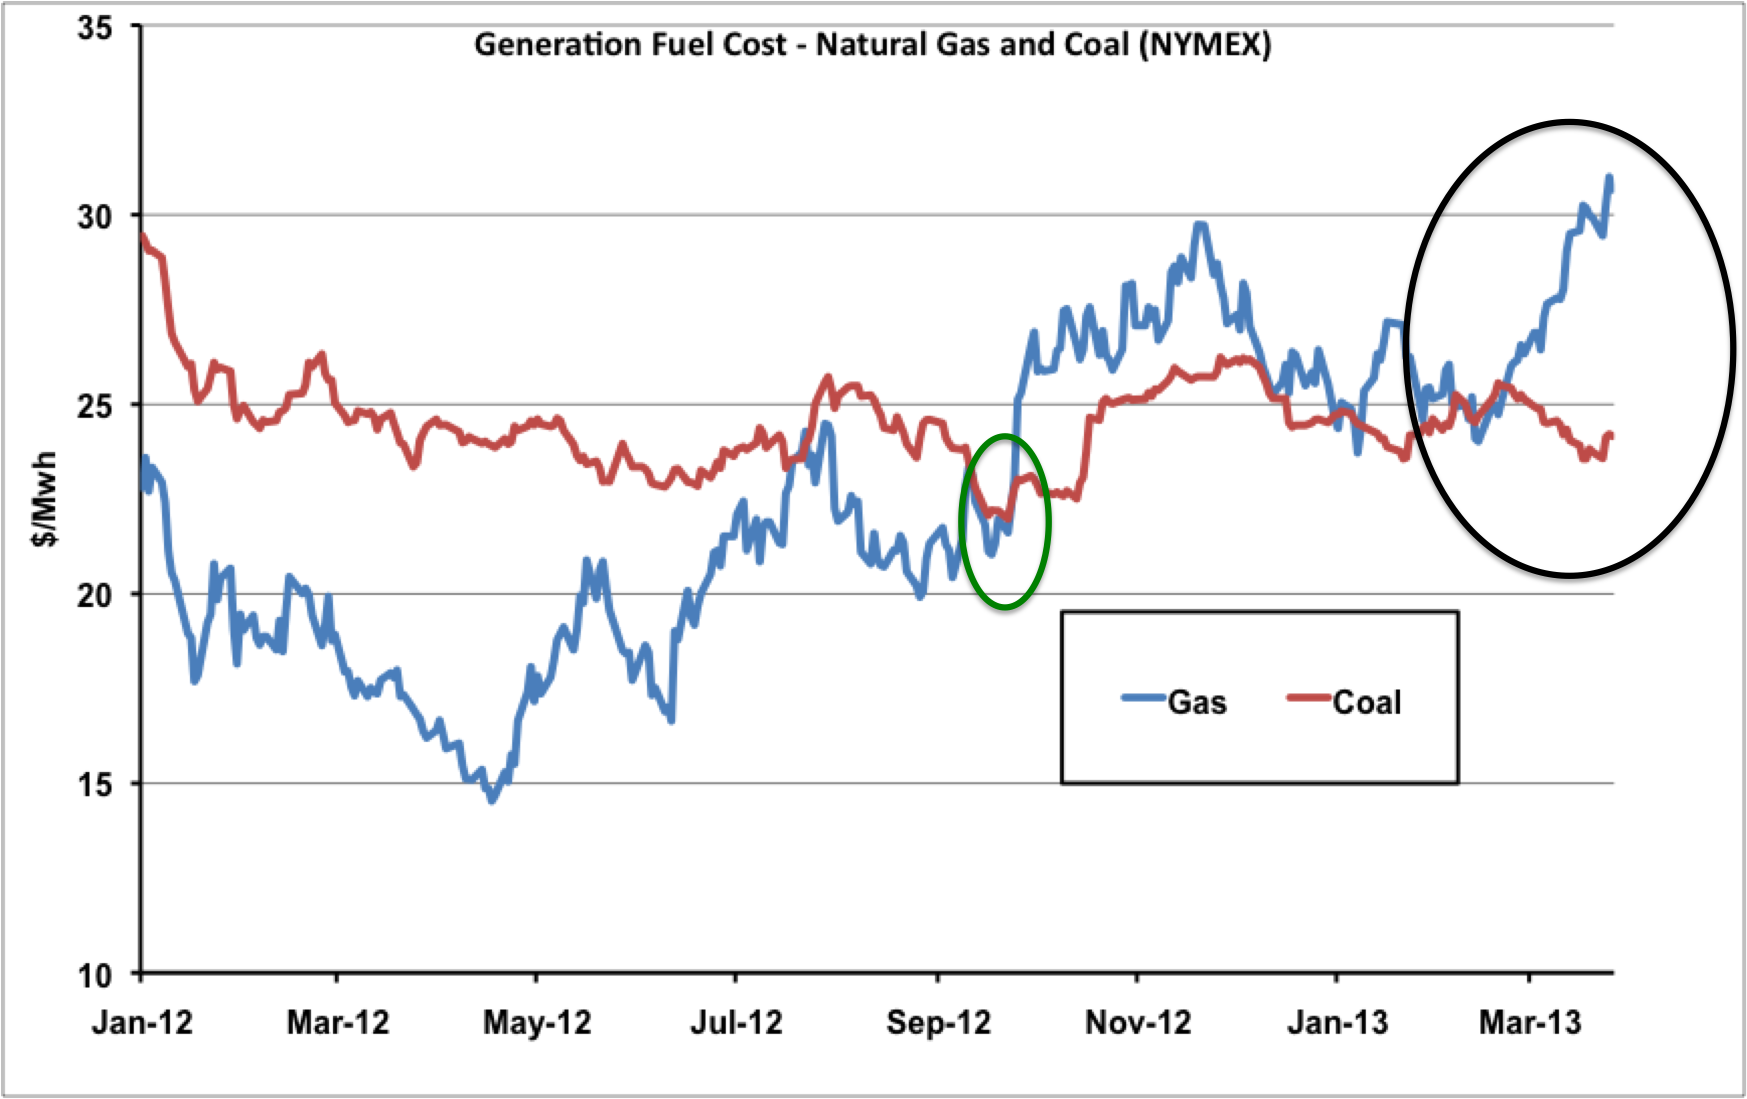
To calculate fuel costs we looked at generation plant economics in terms of efficiency. By this we mean how efficiently the plant converts hydrocarbons in the shape of coal or natural gas molecules into electricity. Plant efficiency is measured in btu’s (a unit of energy) per kilowatt hour (btu/kwh). In a perfect plant it would take 3412 btu to generate 1 kwh of electricity at 100 percent efficiency. That perfect plant does not exist. An average natural gas combined cycle gas turbine (CCGT) plant runs at 44.78 percent efficiency (source EIA) and an average coal plant has 33.64 percent efficiency. These efficiency rates are also known as heat rates. We translated these efficiency numbers into $/MWH by applying an efficiency factor to NYMEX natural gas and NYMEX Appalachian coal prices. You can go back and look at the original calculation via the link to the previous blog but to save time here we will cut to the chase and tell you that to get our results we multiplied the gas price ($/MMBtu) by 7.619 and the coal price ($/Ton) by 0.4226. The chart below shows the fuel cost comparison data since the start of 2012.
Source: CME data from Morningstar
The fuel cost for our typical natural gas plant is the blue line on the chart and the fuel cost for a typical coal plant is the red line. You can see that the gas cost is below the coal cost until the end of September 2012 (green circle). That was the time period when most coal to gas fuel switching happened last year. After September coal costs stayed close to or below those for natural gas generation and coal to gas fuel switching declined. Since the end of February 2013 the cost of natural gas has increased by over $5/Mwh while coal has fallen slightly (black circle). In other words the recent upturn in natural gas prices has made it about 16 percent more expensive to generate electricity with natural gas than with coal using our typical plant configuration. In fact the cost of power generation with coal has been less expensive for most of this winter. The chart below looks at the same data in a slightly different way to make the point more clearly.


Comments
Thanks for the article. I like reading your and other RBN articles. Knowing how things really happen is key to making money. Details and incentives
Incremental CapEx will likely drive the switching. Every time a coal plant needs a major capital it'll be retired. There will be fewer coal plants coming out of successive outage seasons. Also NG plants can be closer to the consumer reducing transmission losses.
Excellent article, especially the charts and the list of important caveats.
Another way of portraying the information in the first chart is to put weekly nearby natural gas futures vs. KOL (the ETF of coal producers) on a percentage change chart for a two-year period. From April 2011 to April 2012 they moved lower in tandem, but not exactly lockstep.The crossover (stronger gas) began in April 2012 and led to a fairly consistent gap for several months, then like the chart above, an explosion wider occured in March 2013 and continues to this day.
There's an investment opportunity there, but as the old saying goes, the market can stay (seemingly) irrational longer than you can stay solvent.