Last week (March 18, 2013) the CME NYMEX Henry Hub futures contract open interest reached a record 1.32 MM contracts. The previous high was in April 2012. Open interest represents the number of positions held by futures market participants that are not yet offset by another transaction, by delivery or by exercise. Today we look at what lies behind the run up in natural gas futures traffic.
We have previously covered open interest in RBN Energy blogs about the commitment of trader (COT) reports (see What’s The Open Interest Kenneth? and The Long and Short of It). Open interest should not be confused with volume, which is the number of trades or transactions that occur on the exchange. The chart below shows the history of the volume and open interest in the Henry Hub futures contract since it began trading in 1990. The red line represents total volume and the blue line is total open interest. By “total” volume and open interest we mean the total for all the delivery month contracts currently trading for natural gas Henry Hub. You can see from the chart that total open interest is always higher than volume. That is because volume is only a measure of daily transactions whereas open interest measures the total outstanding positions held by participants.

Source: CME data from Morningstar (Click to Enlarge)
To get some idea of the magnitude of Henry Hub futures contract trading today compare the NYMEX open interest and volume with actual US production of dry gas as follows:
March 2013 average NYMEX Total Open Interest = 1.2 MM contracts
Each contract is 10,000 MMBtu so 1.2 MM contracts = (1200000 * 10000 * MMBTU) = 12,000,000,000 MMBTU.
Assuming ~ 1 million MMBTU = 1 Bcf of gas
12,000,000,000 MMBTU = 12000 Bcf
Current Lower 48 US “dry” or residue gas production is ~ 64 Bcf /d
Therefore Total OI = (12000/64) = 187 * daily dry gas production
Using the same math, March 2013 average NYMEX Total Volume of 412 M contracts = 64 * daily dry gas production.
Volume in the prompt month only (April 2013) on March 19, 2013) was 143 M contracts or 22 * daily dry gas production.
Open interest in the prompt month only (April 2013) on March 19, 2013 was 79.6 M contracts or 12 * daily dry gas production
Notice that open interest in the prompt month (April 2013) is much lower than volume in the prompt month on March 19, 2013. That is because almost all participants holding prompt month contracts close out their positions before the contract expires (March 28, 2013) to avoid going into delivery (see Henry The Hub I Am Part 2 for more on futures delivery mechanisms). The chart below shows the breakdown of open interest and volume by delivery month on March 19, 2013. Along the bottom of the chart are delivery months and on the left axis the number of contracts. The open interest (red) is highest for the second delivery month out (May 2013). Further out the October open interest (the start of winter) is the highest in 2013 and 2014. Volume tends to be highest in the nearby contracts and to fade off into the future although the October 2013 contract had good trading volume on March 19, 2013. Although contracts are listed and traded out to 2025, the vast majority of volume and open interest are seen in the first two years out.
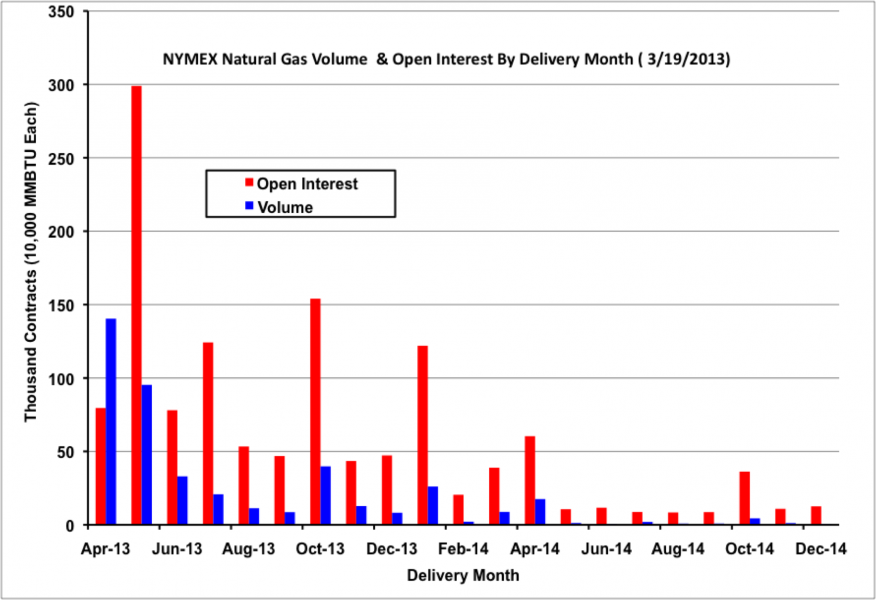
Source: CME Data from Morningstar (Click to Enlarge)
It is not immediately apparent why open interest should be hitting record numbers just now on the NYMEX. During 2012 natural gas prices hit a 10 year low in April (under $2/MMBtu). Physical gas volumes have fallen off because the price spreads between trading hubs in the US have narrowed - making it harder to profit from the arbitrage between geographic locations. Rampant new US gas production is also changing traditional basis relationships and making storage requirements harder to forecast. A number of trading firms have cut back their operations as a result. In November 2012 Freepoint Commodities laid off gas traders and in May 2012 the Centaurus Hedge Fund that traded natural gas closed down. The dreary outlook for physical gas trading is reflected in data from the Intercontinental Exchange (ICE) electronic exchange. The chart below shows monthly average natural gas day ahead trading volumes on ICE at US trading hubs. The data shows that trading volumes in 2013 are down about 10 percent since 2012 and that December 2012 volumes were down 20 percent versus the prior year.
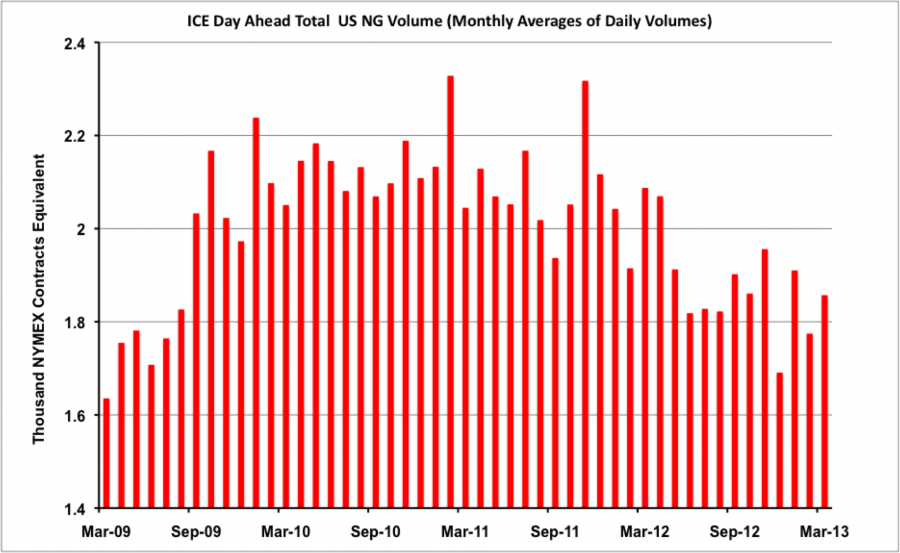
(Click to Enlarge)
Yet NYMEX natural gas contract traffic appears to be moving from strength to strength. Some of the recent increase in volume and open interest is attributable to the colder 2012/2013 Winter and the resultant reduction in record gas inventory levels. That has helped drive prompt month futures prices up more than 20 percent since the start of 2013 to reach a high close to $4/MMBtu last Tuesday (March 19, 2013) before slipping back to $3.927 / MMBtu by the end of the week. We also believe that natural gas producers pay careful attention to the CME calendar strip futures price when deciding on their hedging strategy. That strip is the average price for the nearby twelve months futures contracts and it is now trading above $4/MMBtu – it closed at $4.12/MMbtu this past Friday. [Follow the 12 month CME natgas strip daily via RBN’s Spotcheck - click here if you have trouble accessing.] Producers believing that fundamentals will not support current prices for the rest of the year are jumping into the market to establish hedges with the strip at $4/MMBtu.
While producers have been increasing short positions to hedge their future sales, there has been no shortage of speculative interest from buyers believing prices are still rising. The CFTC commitments of trader (COT) reports indicate that speculators (money managers and hedge funds) have increased their long open positions (buys) in natural gas over the past winter. The blue line on the chart below is the net long open positions (buys greater than sells) during the past year (see What’s The Open Interest Kenneth? for more on COT reports). When the blue line crosses above zero (red line) the speculators have more open long positions (buys) than short positions (sells). Speculators have been net long since November 2012 indicating that the market believes prices will rise further. (Recall however our previous caveat that CFTC position reports can be misleading for a number of reasons – in this case because they do not indicate which future delivery periods speculators are buying into).
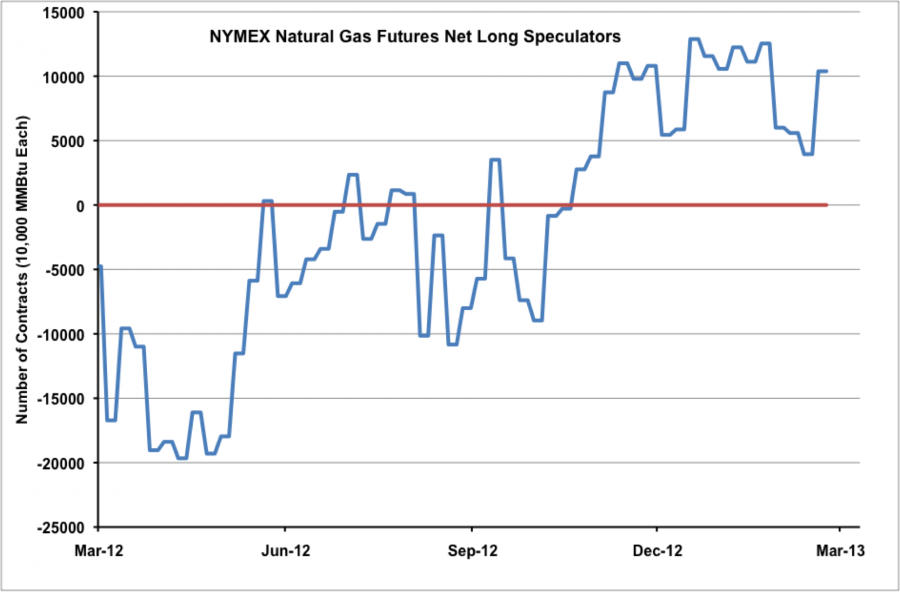
Source: CFTC Data from Morningstar (Click to Enlarge)
Increased futures volume these days is partly due to high frequency computerized trading. Recent high frequency trading incidents prompted investigation by the Commodity Futures Trading Commission (CFTC) into suspected front running before the Energy Information Administration weekly natural gas storage report release (see Those Were the Days). Note that this computer generated trade volume is typically intraday and does not therefore register as open interest.
Broadly speaking the record open interest in NYMEX Henry Hub futures reflects increased attention paid to the natural gas market by producers and consumers. Dry gas production in the US has been at record levels during the past year. Prices are not expected to increase significantly this year (2013) unless demand soaks up more of the surplus inventory this summer. An increasing array of industries are therefore looking to natural gas as a low price source of fuel and we can assume that they are looking to the futures market to hedge their exposure to gas prices.
For the natural gas industry as a whole record open interest indicates a healthy market and guarantees transparent pricing signals. Open interest and volume trading in CME Henry Hub contracts dwarf physical market activity. The success of the futures market reflects the increased role that natural gas is playing in the life of Americans and its future importance as a staple source of energy. Something to brag about.
|
Each business day RBN Energy releases the Daily Energy Post covering some aspect of energy market dynamics. Receive the morning RBN Energy email by signing up for the RBN Energy Network. |
“Something to Brag About” was recorded by George Jones and Tammy Wynette in 1971


