The volume of crude moving out of Corpus by barge and tanker increased from 7 Mb/d in January 2012 to 370 Mb/d in May 2013. At the same time two 300 Mb/d plus pipelines from the South Texas Eagle Ford to Houston are running at less than half full. We know these stats because of information from a company called Clipper Data, which among other things provides detailed waterborne movements of Eagle Ford crude from the Port of Corpus Christi to Gulf Coast destinations. Today we examine the shipping data for clues.
At the end of May 2013 Market Intelligence firm Clipper Data launched an Eagle Ford Marine Data Survey to complement their weekly survey of US crude oil imports – US Import Week. The basis of the Clipper Marine Data is shipping information about crude movements out of the Port of Corpus Christi. The company uses proprietary methods that we will describe in a minute to identify how much crude is shipped out of Corpus and where it ends up on the Gulf Coast. Using that data Clipper then estimates local refinery consumption of Eagle Ford crude and subtracts those volumes from crude production estimates to imply pipeline movements into Houston.
While RBN Energy has described these crude movements we haven’t had access to the destination detail and volumes that Clipper provide. We did describe the significant increase in marine (barge) traffic out of Corpus and the 6 marine terminals in the Port (see We’re Jammin’ But Can All Dat Crude Get Through?). In 2011 the Port of Corpus Christi reported just 14 barges were loaded with crude (all year). During 2012 the outbound waterborne volume from Corpus increased from 7 Mb/d in January to 250 Mb/d in December and has continued to increase to a total of about 370 Mb/d in May 2013 (see chart below). We described the Eagle Ford takeaway infrastructure and capacity in detail at the end of January 2013 (see Too Much Too Soon). In that post we calculated that there was at least 4 times as much pipeline takeaway capacity in the Eagle Ford as was required. Clipper estimate that Eagle Ford crude production in May 2013 was close to 1 MMb/d with local refinery consumption of just under 400 Mb/d – leaving 600 Mb/d needing transportation to market. The great majority of that crude is being shipped out of Corpus Christi by barge and tanker.
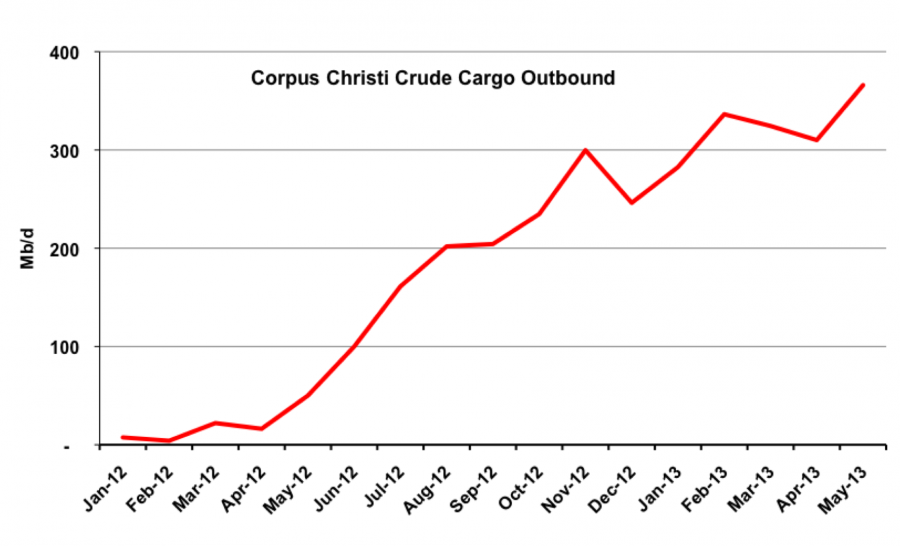
Source: Port of Corpus Christi Data (Click to Enlarge)
The chart below from Clipper shows the breakdown of marine traffic out of Corpus between weeks 14 and 25 of this year. Movements occur on one of three vessel types – large ocean going tankers (~350 MBbl capacity), articulated tank barges (ATBs, 120-230 MBbl) and smaller barges that carry 10 or 30 MBbl each in convoys of up to three at a time. (For more on coastal crude movements by barge see Good Year for the Barges). As you can see from the chart, barges (blue line) carry most crude barrels out of Corpus, closely followed by tankers (red line) and ATBs (orange line). All of these vessels are subject to the Jones Act (see The Sea and Mr. Jones). Clipper capture this data by tracking ocean-going tankers, ATBs and barge tugs using publically available Internet based automatic identification system (AIS) data. In addition, Clipper has set up cameras along the Gulf Intracoastal Waterway to capture the size of the barge(s) being pushed.
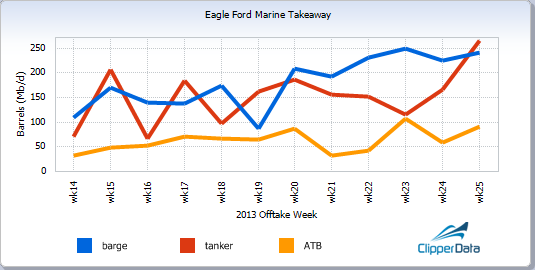
Source: Clipper Data www.clipperdata.com (Click to Enlarge)
Using this technology, Clipper tracks vessel movements out of Corpus Christi to destinations along the Gulf Coast. The table below shows all the outbound crude movements from Corpus Christi in May 2013. The left hand column lists the ports where the crude loaded at Corpus is delivered to (Offtake Port). Column two lists the specific terminal (Offtake Point) within each port that the crude was delivered to. For example the first port in column 1 is Morgan Point and deliveries are all made to the Louisiana Offshore Port (LOOP) terminal. The second port in column 1 is Houston and there are 11 terminals inside the port listed in column 2 etc. The third column indicates the actual volume delivered to each terminal in total barrels and the right hand column is the average in Mb/d. The red lines in the table are the subtotals of deliveries to each Port.
Join Backstage Pass to Read Full Article


