September NYMEX natural gas closed up a nickel yesterday at $2.96/MMbtu. The January 2013 contract closed at $3.537 – a winter summer spread of $0.57/MMbtu, but the average seasonal spread in the futures market has fallen from $0.62/MMbtu just two years ago to $0.39/MMbtu this week. There was a time not that long ago when the winter-summer spread was measured in dollars. Now it seems to be fading into oblivion. Today we search for signs of seasonality in the forward curves.
We’ve talked about forward curves before - for Brent and WTI crudes (see “A Bridge Too Far – When Will the WTI Discount to Brent End?” ). The value of forward curves is that by looking at daily settlement prices for natural gas futures contracts linked to successive delivery dates we can understand the current trading value that the market places on future deliveries.
The Curves
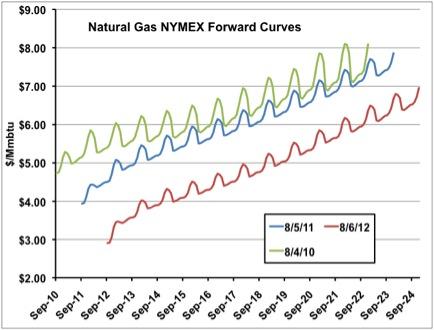
The chart below shows natural gas forward curves for one day each during August 2010, 2011 and 2012 respectively. The latest curve (red line) is for Monday, August 6, 2012. These forward curves have a rippled shape. That shape results from winter prices being higher than summer prices a.k.a. seasonality. Natural gas prices are higher in the winter than the summer because gas consumption peaks have traditionally been higher in winter. Notice however – and we will take a closer look at this next – that the winter boost to gas prices that causes the seasonal wave seems to be losing its strength. The waves in the 2010 curve are higher than those in 2011 and the 2012 curve has muted seasonality.

Source: CME NYMEX Data from Morningstar
Seasonal Storage Spreads
The traditional seasonal nature of natural gas prices is the backdrop to the age-old theory of natural gas storage spreads. Natural gas storage spreads used to be a reliable feature of the US market. The assumption was that you could buy natural gas at low prices in the summer months, ship it to the consuming regions, inject it into storage and then sell it for a handsome profit come winter as cold weather caused prices to spike. Like all good cast iron theories – this one has been the cause of more than one shipwreck along the way. The most notable was the infamous Amaranth blowout in September 2006 (see http://online.wsj.com/article/SB115861715980366723.html) when a single trader lost $5.0 billion and tanked his hedge fund betting on the spread between winter and summer natural gas spreads.
Join Backstage Pass to Read Full Article


