NYMEX natural gas prices have fallen 16 percent since reaching their high for the year so far of $4.408/MMBtu on April 19, 2013. The NYMEX August contract closed at $3.582/MMBtu on June 27, 2013.The market is currently in the low demand shoulder season. Winter is over and summer heat is on the way but temperatures in May and June are not typically high enough to significantly increase demand for air conditioning. Today we review shoulder season gas market fundamentals.
There are two “shoulder” seasons in the gas year. These are the periods when demand for gas is at its lowest. The term derives from the fact that demand either side of the winter peak has a shoulder pattern - coming down in the spring when temperatures increase and going up in the fall when temperatures cool down. The right shoulder is the period after winter and before the height of summer – that’s where we are right now. The left shoulder comes in the fall. When we last reviewed natural gas fundamentals at the start of April we noted that prices had increased by 25 percent since the start of 2013 (see Spring is in the Air). Since the end of April – during the shoulder season - prices have been falling as temperatures have warmed.
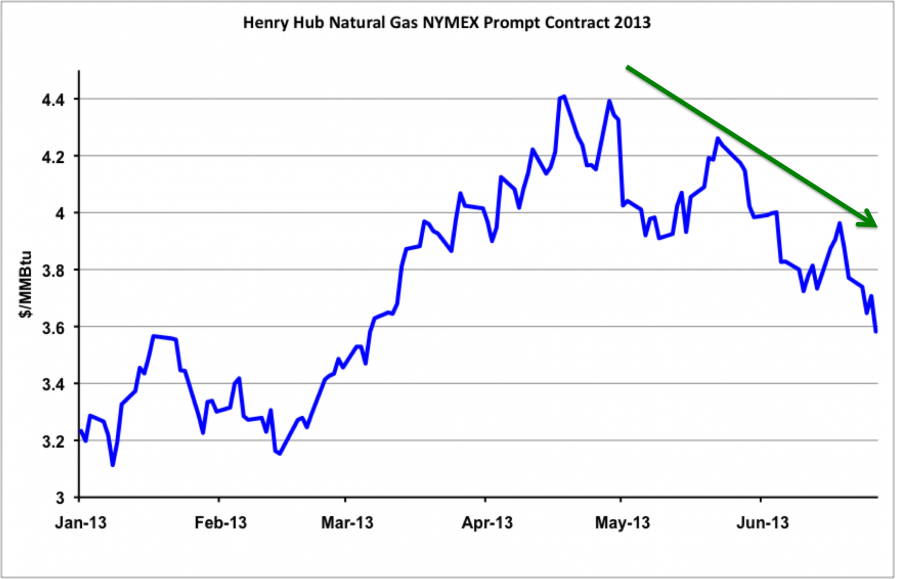
Source: CME Futures Data from Morningstar (Click to Enlarge)
The chart above shows settlement prices for the natural gas nearby futures contract so far this year (2013). After a relatively mild start to the winter in January and February, prices shot up in March and April in response to a late winter cold spell. The increased demand for residential and commercial space heating during the cold spell helped to pull more gas out of storage. However, after reaching a high of $4.40/MMBtu in April, NYMEX gas prices retreated in the face of lower demand from power generation – forming the downward “right” shoulder typical in May and June (green arrow on the chart). In 2012 that downward pattern never happened because gas prices fell so low in April last year that they attracted more system operators to use gas fired generation. That power burn kept prices from falling any lower during the May and June 2012 shoulder months. This year rising prices for natural gas since February meant power system operators switched back to coal powered generation (see Summer Power Burn). In the absence of additional demand from power burn, prices have been weaker since the end of April and storage injections have increased. Although storage injections are expected during the shoulder seasons because demand is low, too much storage build up early in the year can weigh heavily on market prices.
Energy Information Administration (EIA) weekly natural gas storage data indicates a marked upturn in gas injected into storage since April. The chart below shows EIA data for the 2012/2013 storage season (red line) as well as the 2011/2012 season (blue line) and the 5-year average (green line). The blue line charts the exceptional year of 2011/2012 when gas storage reached record heights after the warmest winter on record. This winter from October to March (and including a late cold spell in April), high demand for gas brought storage levels back down to earth. By the beginning of April storage levels had dipped below the 5-year average (black circle on the chart). Since then demand for gas has fallen back as warmer weather reduced heating demand and more power generation switched to cheaper coal. The result was a return to storage injections and a more seasonal pattern of storage numbers since April. In the past three weeks those storage numbers have been edging up towards the 5-year average again in the absence of new demand. Trouble is that although “5-year average” sounds like a “normal” situation, in this case the average includes the “outlier” year of 2011/2012, which skews it towards the high side. That means storage levels are arguably still higher than they “should be” at this time of year.
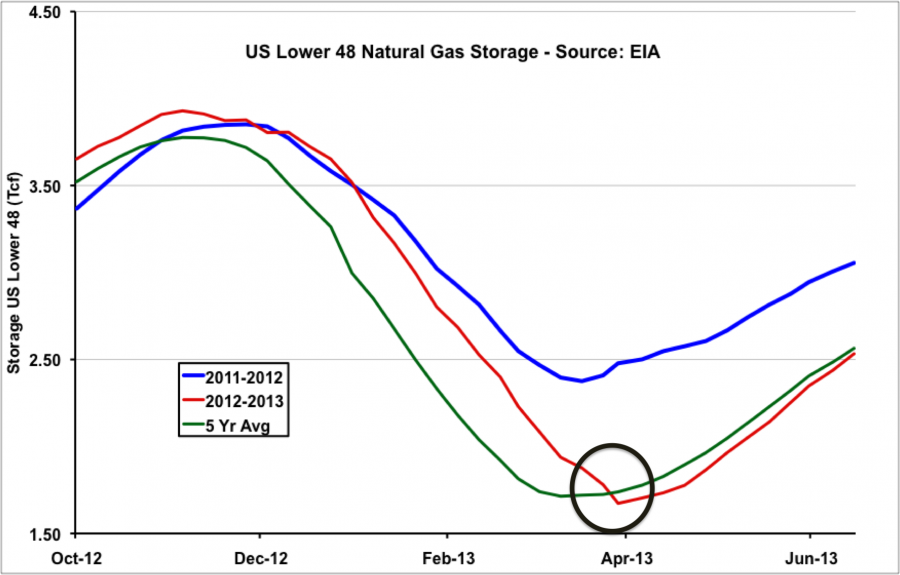
Source: EIA Data from Morningstar (Click to Enlarge)
Delving a little deeper into the fundamentals we looked at the Bentek Cell Model daily natural gas supply demand balance for June 26, 2013. The table below shows the data with the supply position summarized in the top half and demand at the bottom. All the numbers are in Bcf/d. The left hand side of the table compares June 2013 against June 2012 and on the right are year-to-date comparisons. The supply data shows natural gas dry production still increasing in June by 2.3 percent (blue circle) and in the year to date by 1.8 percent (red circle) to 64.4 Bcf/d versus the same period last year (63.2 Bcf/d). Continuing efficiency improvements are resulting in growing natural gas production in spite of reductions in the Baker Hughes horizontal gas drilling rig count that is now 86 below last year at 1,086. The shoulder months are the danger period for increased supplies because demand is lower and that means more gas heads into storage.
Join Backstage Pass to Read Full Article


