In the last 12 months, U.S. natural gas prices have touched highs not seen since the start of the Shale Revolution as well as depths previously plumbed only briefly during downturns in 2012, 2016 and 2020. Where will prices go next? Well, if we knew that, we wouldn’t be writing blogs. As we’ve seen in the past couple of years, there’s just too much going on in global markets to think you can know where gas prices will be 10 years, five years or even one year from now. But that never stopped us from trying. As we’ve done many times before, we’ll take a scenario approach — a high case and a low case. In today’s RBN blog, we’ll explore these scenarios for domestic natural gas prices and what sort of ramifications each would entail for other markets.
Just over one year ago, on August 22, 2022, the prompt Henry Hub price settled at $9.68/MMBtu — it was the zenith of a five-month run in which the benchmark regularly settled in the $7-$9/MMBtu range. Henry averaged just over $6.50 in 2022 (dark green horizontal line to left in Figure 1), significantly higher than any single day’s settlement since 2008, when shale drilling first started making domestic gas abundant and cheap. (The highwater mark between those two eras was February 19, 2014, when Henry settled at $6.15/MMBtu.) While gas sellers in the U.S. likely have fond memories of that time, gas buyers, especially those on the other side of the pond, were having a far different experience.
Join us at our historic 20th School of Energy!
School of Energy: Foundations is a two day, in person conference designed to help energy professionals better understand the forces shaping crude oil, natural gas, NGLs, refined products, and petrochemicals.
Attendees will learn from RBN experts, work with Excel based analytical models, participate in Q&As, and network with industry peers.
Build the foundation to better navigate volatile energy markets.
However, the price rally didn’t survive into 2023 and so far this year, Henry Hub has averaged just $2.58/MMBtu (dark blue horizontal line in lower-middle), a price lower than break-even for nearly all natural gas-focused plays. The nadir was on April 13 when NYMEX settled at $2.01/MMBtu. Prices have edged higher since then, up to about the $2.50 - $2.60/MMBtu neighborhood, with many days higher than that, due to strengthening LNG feedgas demand and a sweltering summer that’s caused power demand to surge. The price is off a bit lately as temperature forecasts are starting to moderate, LNG feedgas has slowed and production remains robust.
The forward curve (yellow line) runs comfortably between the extremes of the past year and averages $3.45/MMBtu through 2024 (brown horizontal line to right). One more data point: The Energy Information Administration’s (EIA) Short Term Energy Outlook (STEO; orange line) is pretty close to that. But if you’ve ever been to one of our previous School’s of Energy, you’ve surely heard us say, “Futures prices are no indication of future prices.”
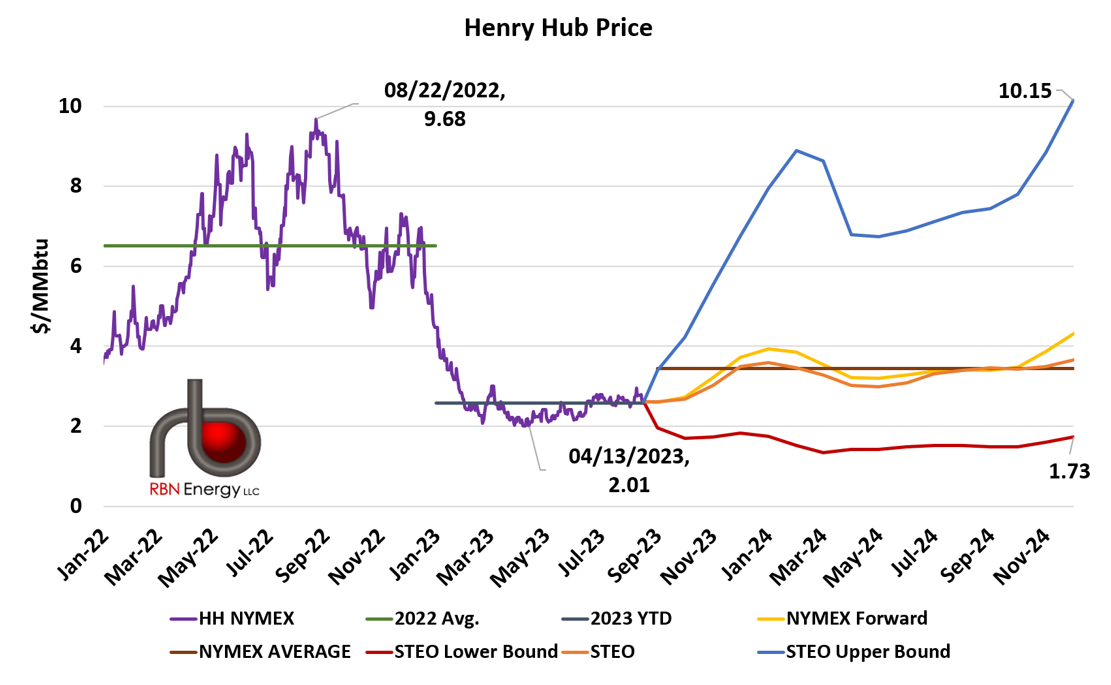
Figure 1. Henry Hub Historical and Forward Price. Sources: CME/NYMEX, EIA STEO

About the song
“The Bonnie Banks of Loch Lomond” is a Scottish folk song that is listed in the songs from oral traditions, Roud Folk Song Index, as song “number 9598.” Loch Lomond is the largest Scottish loch, or inlet from a sea. “Bonnie” in the Scots language means “attractive.” Scottish folk-rock band Runrig made the song their anthem, closing their concerts with it for over 25 years. It is the favorite song of the Scotland rugby team, and of the Tartan Army, as supporters of the Scottish football (soccer) team are known. It appears as the fifth song on side one of Runrig’s second studio album, The Highland Connection. The album was released on the band’s own label, Ridge Records, in the spring of 1979. Personnel on the record were: Donnie Munro (lead vocals, guitar), Rory Macdonald (bass, vocals), Calvin Macdonald (percussion), Robert Macdonald (accordion), Malcom Jones (guitar, pipes, accordion), and Blair Douglas (keyboards, accordion).
Runrig was a Scottish Celtic folk-rock band formed on the Isle of Skye in 1973. The band was most successful in the 1980s and ’90s. The group announced their final tour, The Final Mile, in September 2017 and played their last show in Stirling’s City Park in 2018, ending the night with their final live rendition of “Loch Lomond.” Twelve members passed through the group during its existence. They released 14 studio albums, seven live albums, eight compilation albums, three EPs and 28 singles.