In the last 12 months, U.S. natural gas prices have touched highs not seen since the start of the Shale Revolution as well as depths previously plumbed only briefly during downturns in 2012, 2016 and 2020. Where will prices go next? Well, if we knew that, we wouldn’t be writing blogs. As we’ve seen in the past couple of years, there’s just too much going on in global markets to think you can know where gas prices will be 10 years, five years or even one year from now. But that never stopped us from trying. As we’ve done many times before, we’ll take a scenario approach — a high case and a low case. In today’s RBN blog, we’ll explore these scenarios for domestic natural gas prices and what sort of ramifications each would entail for other markets.
In observance of Labor Day, we’ve given our analysts a break and are revisiting our August 26 blog on U.S. natural gas price scenarios and the potential impacts. The blog also serves to highlight the market interconnections that are the theme of our upcoming School of Energy conference. If you didn’t read it then, this is your opportunity to see what you missed.
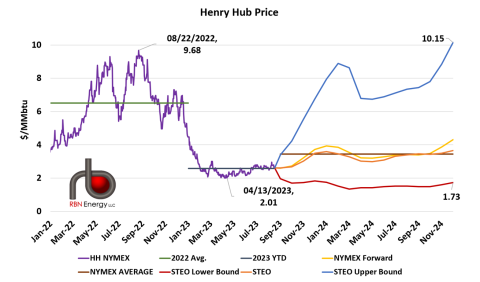
Just over one year ago, on August 22, 2022, the prompt Henry Hub price settled at $9.68/MMBtu — it was the zenith of a five-month run in which the benchmark regularly settled in the $7-$9/MMBtu range. Henry averaged just over $6.50 in 2022 (dark green horizontal line to left in Figure 1), significantly higher than any single day’s settlement since 2008, when shale drilling first started making domestic gas abundant and cheap. (The high-water mark between those two eras was February 19, 2014, when Henry settled at $6.15/MMBtu.) While gas sellers in the U.S. likely have fond memories of that time, gas buyers, especially those on the other side of the pond, were having a far different experience.
However, the price rally didn’t survive into 2023 and this year Henry Hub has averaged just $2.60/MMBtu (dark blue horizontal line in lower-middle), a price lower than breakeven for nearly all natural gas-focused plays. The nadir was on April 13 when NYMEX settled at $2.01/MMBtu. Prices have edged higher since then, up to about the $2.50-$2.70/MMBtu neighborhood, with many days higher than that, due to strengthening LNG feedgas demand and a sweltering summer that’s caused power demand to surge.
The forward curve (yellow line) runs comfortably between the extremes of the past year and averages $3.45/MMBtu through 2024 (brown horizontal line to right). One more data point: The Energy Information Administration’s (EIA) Short Term Energy Outlook (STEO; orange line) is pretty close to that. But if you’ve ever been to one of our previous Schools of Energy, you’ve surely heard us say, “Futures prices are no indication of future prices.”
Figure 1. Henry Hub Historical and Forward Prices. Sources: CME/NYMEX, EIA STEO
Join Backstage Pass to Read Full Article


