On Friday (March 4, 2016) the April NYMEX/CME futures contract settled at $1.666/MMBtu, the lowest contract settlement since 1999. Rock bottom prices reflect a growing supply/demand imbalance and concerns about hitting storage capacity limits later this year. Last Thursday’s EIA report showed U.S. gas inventory stands 827 Bcf above last year at this time and 687 Bcf above the 5-year average. These are the biggest surpluses the market has seen since 2012. Moreover, our latest NATGAS Billboard storage outlook shows March withdrawals lagging way behind last year and expanding the surplus further heading into April. In today’s blog, we look at how a similar situation was resolved in 2012 and what it will take to bring down the surplus this year.
First we take a look at where we are now in early March – the last month of the winter withdrawal season. The latest Billboard storage estimates (RBN’s new natural gas market report developed with Criterion Research, as of March 4, 2016) indicate the market will withdraw a net 70 Bcf between now and March 25, including the likelihood of two weekly injections (yes – we mean injections) in mid-March. That’s compared to last year’s 248-Bcf draw in the same period and a 5-year average draw of 245-Bcf. Injections are not uncommon in March as the weather begins to transition from winter to spring and overall temperatures rise. However, considering that storage inventories started this March much higher than last year or the 5-year average, early injections this year will only exacerbate the current oversupply conditions. Based on these storage estimates, our Billboard analyses projects that natural gas in storage will end the withdrawal season (Nov-March) slightly above 2,400 Bcf, about 900 Bcf higher than 2015 and about 800 Bcf above the 5-year average, which is an enormous surplus in storage heading into the summer injection season (April-Oct).
This surplus is the key feature of the market this year. It not only reflects the current imbalance between supply and demand but also indicates how big a correction is needed to bring the market back into balance. There are very specific implications for the gas market in 2016 because the surplus cannot grow indefinitely as storage capacity is finite. Limited storage capacity not only puts a ceiling on inventory levels but also puts a time constraint on drawing down the mountain of gas already in storage. Last year, inventories peaked at their all-time high of 4,009 Bcf in November. If the market were to end March with a 900-Bcf surplus versus last year, as Billboard projects, and carry that surplus through to November 2016, inventories would peak at 4,909 Bcf. But as we pointed out in Hot Stuff, this is not physically possible, given that U.S. storage capacity is only believed to be 4,300 Bcf. So the outstanding market question is how exactly will storage balance this year and what will it take? Basically the solution has to come either from lower supply (meaning less production) or higher demand.
The last time the gas storage surplus reached similar heights was back in 2012. Next we’ll take a look at how record gas inventories that spring were tackled.
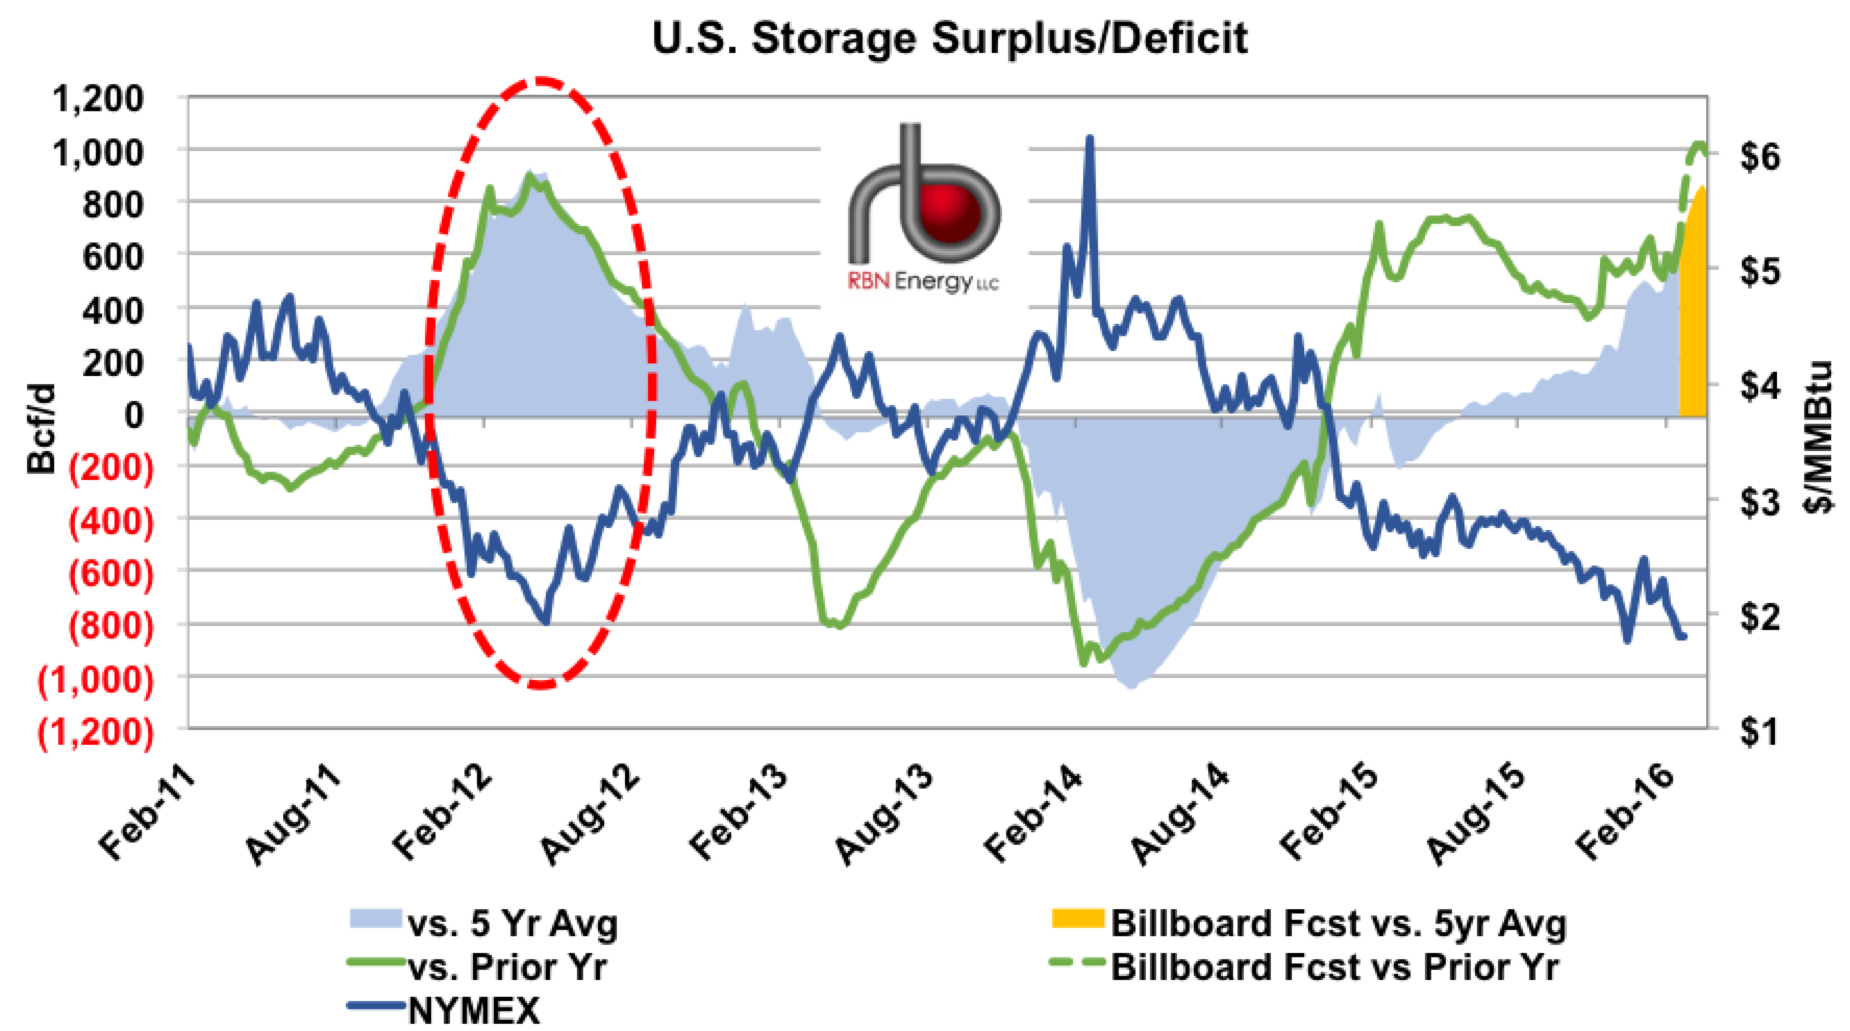
Figure 1; Source: NATGAS Billboard, Criterion Research, EIA
The graph in Figure 1 shows the historical gas inventory surplus (positive) or deficit (negative) compared to the prior year (green line) and the 5-year average (blue shaded area) from January 2011 to present (against the left axis). The right-most peaks are the current surpluses as described above, including our projected surplus versus last year (green dashed line) and the 5-year average (yellow shaded area). And, if we pan left from the current peaks, we can see the last time the surplus was at this level in 2012 (red dashed circle). Inventories in 2012 ended March at 2,472 Bcf - an 893 Bcf surplus to the prior year. However, that’s where the surplus peaked and began an extended decline through that summer, ending October 2012 at less than 100 Bcf above the prior year. This correction in 2012 was entirely due to increased demand. That summer, storage injections were just 1,435 Bcf compared to between 2,000 and 2,800 Bcf in the other injection seasons from 2011 to 2015. While supply averaged more than 2.0 Bcf/d higher in summer 2012 versus 2011, hotter weather helped prop up demand by increasing gas-fired electricity generation use for air conditioning. On top of that, lower gas prices (blue line in Figure 1 against the right axis) helped incentivize higher gas to coal power switching. Total demand, (including exports) that summer averaged nearly 6 Bcf/d higher than the previous year, more than offsetting the supply growth.

Looking back at that summer of 2012 the evidence suggests that the surplus was largely whittled down by the impact on demand of the significant natural gas price correction to below $2.00/MMBtu in April. Something similar is needed this summer. But there are some key differences between this year and 2012. For one, production is nearly 10 Bcf/d higher now than it was back then. For another, although demand is higher, it has not grown at the same pace. So the imbalance between supply and demand is much greater this year, and that is reflected in the current price level. This winter we have already seen prices at Henry Hub well below $2.00 and indeed they have barely gotten above that level even in the coldest months. As noted above, the April 2016 contract as of Friday (March 4, 2016) settled at $1.666/MMBtu.
About the song
“Nutbush City Limits” was written and originally performed in 1973 by Tina Turner and was the final chart hit that year for Tina and her then husband Ike Turner. Reaching only #22 on the Billboard Hot 100 chart, the song has been covered by many artists since and become one of Tina Turner’s most iconic hits.