Last week (August 7, 2013) the 3-2-1 crack spread based on NYMEX CME crude and refined product prices that is seen as a proxy for the performance of US refinery margins, reached a two year low. The 3-2-1 crack has fallen 56 percent this year from its high in March. At the same time refineries are still processing crude like there’s no tomorrow – at over 90 percent of capacity. Can the party continue? Today we peak through the cracks to uncover what’s going on.
What is a 3-2-1 Crack Spread?
To explain - the term “crack” does not refer to something a wayward crude trader might ingest in the bathroom but rather to breaking down or “cracking” crude oil. The term “spread” means the difference between the sales price of the refined products and the raw material cost of crude i.e. the refining margin. The 3-2-1 Crack spread approximates a refinery that produces two barrels of gasoline and one barrel of diesel for every three barrels of crude input. In other words the refinery yield is two-thirds gasoline, one-third diesel (see Bakken Buck Starts Here Part IV).
In our case the 3-2-1 crack we are looking at is the NYMEX CME futures market proxy for a refinery margin that is calculated using nearby delivery contract prices for New York Harbor gasoline and diesel (aka heating oil) and subtracting the cost of West Texas Intermediate (WTI) crude. This is the most widely followed crack spread because it roughly approximates the state of the US refining business. RBN Energy keeps a running tally on the 3-2-1 crack - you can see that chart and those of other important market indicators on our website. You get access to more detail behind the charts if you are an RBN member (see About Spot check Indicators).
Falling Through The Cracks
The chart below shows the 3-2-1 crack spread over the past two years. At the start of that period in August 2011, the WTI price was about a year into its three-year period of heavy discount to the international benchmark Brent crude (for chapter and verse on that saga see Strangers in the Night). Because inland crude prices like WTI were low, and the price of refined products in New York on the East Coast were based on higher international crude costs, the 3-2-1 crack in August 2011 was hovering around a very healthy $40/Bbl. Then the WTI discount to Brent narrowed sharply in the fall of 2011 as the market believed that the first phase of the Seaway pipeline reversal would miraculously solve the Midwest crude logjam quickly and that inland crude prices could return to coastal levels. That turned out not to be true once Seaway Phase 1 opened up in January 2012 and had little impact on the huge crude stockpile in Cushing, OK. The WTI discount to Brent widened out again in 2012 and 3-2-1 crack values bounced back over $30/Bbl. And they stayed at those levels until this year. The 3-2-1 crack peaked at $39.40 on March 8, 2013 and ever since then has been on a downward trend – reaching a low of $17.50/Bbl on August 7, 2013.
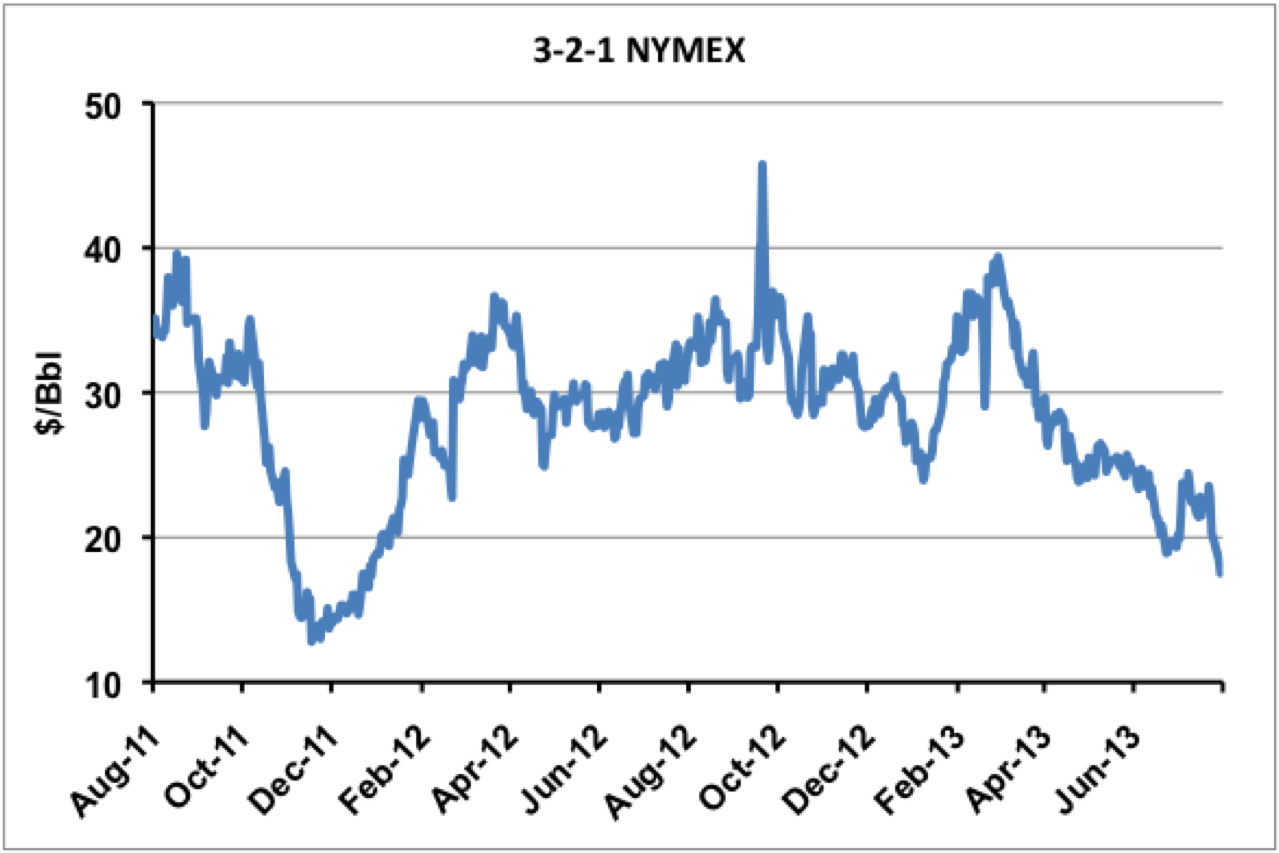
Source: CME data from Morningstar
Why has the 3-2-1 crack spread fallen by 56 percent since March 2013? The chart below shows the components of the spread in $/Bbl this year. The prices of diesel and gasoline (red and blue lines respectively on the chart), the refined products in the crack spread, basically tracked WTI crude prices (green line) through March. During March and April product prices were higher when output from Gulf Coast refineries that normally help meet demand on the East Coast was reduced by refinery maintenance (see Turn Around). That led to the near $40/Bbl 3-2-1 crack in early March. Ever since then the crack spread has tanked and the chief culprit was a rapid increase in WTI prices (brown dotted line on the chart). WTI prices increased by nearly $20/Bbl between April and June and product prices were flat over the same period. During this same period as WTI prices increased, refiners increased their crude throughput rapidly – chasing the higher margins
seen in March. By mid July the resulting increase in refined product output was putting downward pressure on prices (dark green dotted line on the chart) squeezing the crack spread further.
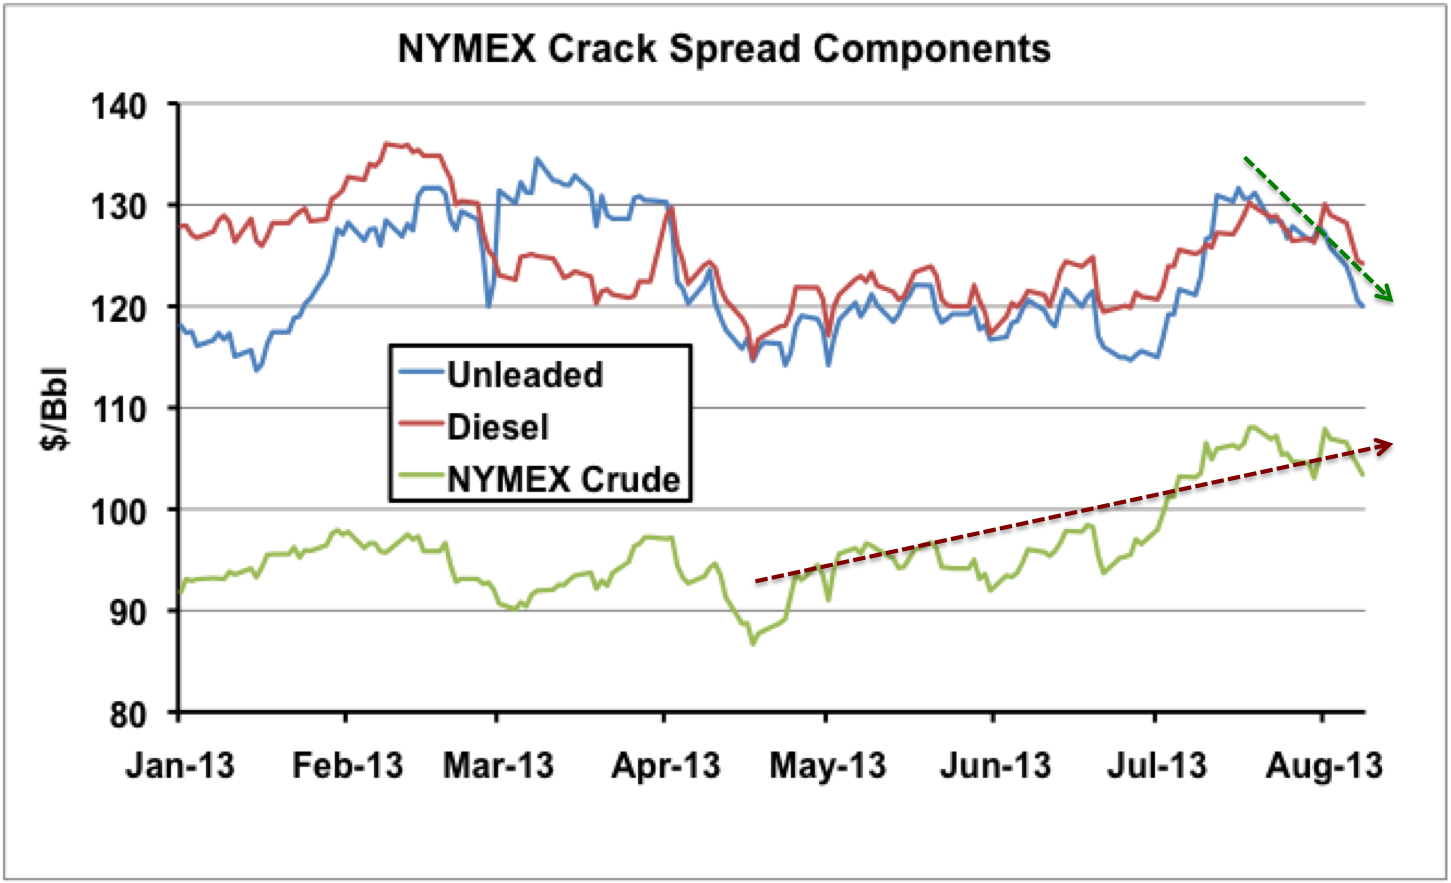
Source: CME data from Morningstar
The rising WTI prices that narrowed the 3-2-1 crack spread so dramatically reflected the unwinding of the WTI discount to Brent. The chart below on the right shows the WTI discount to Brent this year. That narrowing discount was caused by the opening up of new capacity to ship inland crude to coastal markets and reductions in the crude stockpile at Cushing. The WTI discount to Brent narrowed from over $23/Bbl in February to a few cents a barrel in late July before pushing out again to current levels around $3/Bbl. And as the WTI discount to Brent has evaporated, so have the margins that coastal refiners with access to inland crudes enjoyed. The chart below on the left shows both the 3-2-1 WTI NYMEX crack spread (blue line) and the 3-2-1 Brent crack (red line). An East Coast refiner with access to inland crudes priced against WTI (for example crude shipped by rail from the Bakken) would have been able to enjoy the high margin reflected by the WTI crack spread. East Coast refiners processing imported crudes like Brent would have fared less well. The desire to capture those higher margins from inland crudes has driven much of US crude distribution and refining activity over the past 18 months.

About the song
“Money for Nothing” was written by Mark Knopfler and Sting and appears as the second song on side one of Dire Straits’ fifth studio album, Brothers in Arms. Knopfler was inspired to write the song by comments from an employee at a New York City appliance store about an MTV video playing on one of the store’s television sets: “Money for nothing and chicks for free.” Sting makes an appearance on the song, singing “I want my MTV” to the melody of The Police’s “Don’t Stand So Close to Me.” Released as the second single from the LP in June 1985, it went to #1 on the Billboard Hot 100 Singles chart. It won the band a Grammy Award in 1986 and the Video of the Year Award at the third annual MTV Video Music Awards. Personnel on the record were: Mark Knopfler (lead vocals, guitar), John Illsley (bass, backing vocals), Guy Fletcher (synthesizer, Synclavier, keyboards), Alan Clark (Hammond organ), Terry Williams (drum intro), Omar Hakim (drums), and Sting (vocals).
Brothers in Arms was recorded at AIR Studios in Montserrat between October 1984 and February 1985, and produced by Mark Knopfler and Neil Dorfsman. The album was released in May 1985 and went to #1 on the Billboard 200 Albums chart, where it stayed for nine weeks. It has been certified 9X Platinum by the Recording Industry Association of America. Five singles were released from the LP.
Dire Straits was a British rock band formed in London in 1977 by Mark Knopfler, David Knopfler, John Illsley, and Pick Withers. They were active from 1977 to 1988 and again from 1991 to 1995. Twelve members passed through the band since their formation, with Mark Knopfler always at the helm. They released six studio albums, five live albums, three compilation albums, three EPs and 31 singles and have sold more than 100 million records worldwide. Dire Straits has won four Grammy Awards, three Brit Awards and two MTV Video Music Awards and are members of the Rock and Roll Hall of Fame. Mark Knopfler continues as a solo artist and retired from touring after a final concert at Madison Square Garden in September 2019. His latest album, One Deep River, was released in April 2024.
"About the Song" -- written by Mickey McMahan , RBN Director of Musicology

Comments
From today's blog: "At the start of that period in August 2011, the WTI price was about a year into its three-year period of heavy discount to the international benchmark Brent crude."
I'm not employed in the oil and gas biz, but I was curious in 2010 when the Brent and WTI prices started to diverge. Web and media sources and pundits explained the spread as the premium for Brent's low exposure to the threat of terrorism relative to the volatile Mideast, but this didn't make sense because West Texas is even further removed from the terrorism threat.
Months passed before theses sources attributed the spread to Cushing congestion and oversupply. Why did it take so long to come to this realization?
Thanks for your insights.
While the crack spread has definitely declined, do US refineries have profit opportunities by exporting more refined product? If US refineries retool rapidly to add additional light sweet flash capacity, perhaps the ability to increase exports of gasoline and diesel would offset the reduced crack spread.
My understanding is that an atmospheric distallation unit takes about 2 years to construct. Bolting a unit onto an existing refinery could expand production ability subsequent to the widening of the Panama Canal which could expedite shipping of gasoline and diesel to Asia. If the global economy continue to grow, then demand for these products should expand naturally.
There is currently a surplus of crude tankers. I have been told that crude tankers can be converted to carry refined products, so perhaps reduced shipping costs could also create profit opportunities for US refineries.
In reply to How does crack spread affect exports of refined products? by Tom Morgan
don't you figure all the massive refinery capacity coming on in Asia, Russia, and Middle east (and EU refineries off maintanance) are going all conspire to kill most GOM export oportunities. Sure GOM will still get most of Atlantic S. Amer, but Middle east might take much of that too, and with cheap tankers and the Saudi's having way more "advantaged" crude ($30-40/bbl), and it is not too hard to see how US exports might not be so rosy as many hope....
Refining although local in the short term is a global business. We were on the importing end now we may be on the exporting end.
1) Refiner feedstock cost advantage ($3Bbbl? is US with cheap NG sustainable advantage for at least 3-4 years. Valero is betting on this via Hydrocrackers.
2) Refiners have strong balance sheets with very low interest rates compared to 3 years ago. Now they can afford to show discipline 3 years back they had to produce at low margins to service the debt.
3) With WTI trading $14 above last year the producer profitibility is up at least 50-70% (assume $70 cost) production from Bakken and Eagle Ford is likely to accelerate especially now that the back months are rising faster than the front months.
Infrastructure changes that will keep refiner and producer profitability high.
4) With startup of pipelines - Permian, Cushing, Bakken additional midwest refining - will shift $8-10 on @millinon barrles that was captured into refiners and producers pockets. Keeping profitibility and production in high gear. Heated rail cars will play a big role in PADD1. We may even see the restart of idled refineries Yorktown,NJ refineries once the new owners don't have to deal with the legacy union costs with once the union contracts expire.
5) BP Whiting when it switchs to Heavy to 250,000 bpd of canadian crude will have a disptoportionare impact on freeing up infrastructure. This will either raise the WCS price and/or free up the 250,000 equivalent heavy crude carrying capacity and condensate carrying capacity up to chicago.