Natural gas prices at the Waha hub in West Texas plunged below zero again recently after force majeure and maintenance events across multiple pipelines left Permian producers scrambling to move their gas out. Persistent congestion will remain a big headache this fall and likely again in the spring, before the new Blackcomb and Hugh Brinson pipelines come online in 2026. In today’s RBN blog, we’ll highlight the importance of gas-flow analysis and pipeline modeling to preview our upcoming Natural Gas Master Class, which features real-world examples from today’s market, including a look at recent negative pricing in the Permian and Appalachian outflows on Mountain Valley Pipeline (MVP).

Understanding gas flows in the Permian and elsewhere has never been more crucial. The ability to read pipeline data, model regional production and forecast market shifts is what separates accurate analysis from guesswork. Negative gas pricing at Waha happened a record 49 times last year and at least eight times so far this year (where the blue line dips below zero in Figure 1 below). This is directly linked to pipeline outages, seasonal maintenance and surging Permian production. When these events happen, it means surplus gas is trapped, driving spot prices lower.
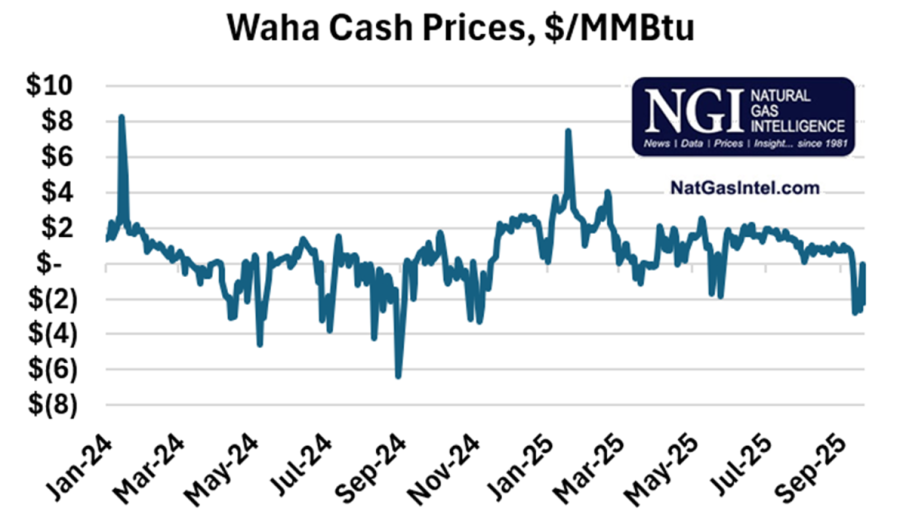
Figure 1. Waha Cash Prices. Source: Natural Gas Intelligence
While the mechanics of that are the same in every pipeline basin, the Permian is unique in that its producers will tolerate negative pricing at the margin. (Keep in mind that most producers and marketers have a combination of price hedges and contracted pipeline capacity for some portion of their supply and don’t necessarily suffer the worst spot prices.) So, while Appalachian producers may cut back or, in a worst-case scenario, curtail output if prices get too low, in the Permian, where oil economics are the driver, producers keep going, often driving cash prices into negative territory.
We know that massive changes are already afoot when it comes to Permian natural gas. We could see two new greenfield pipelines start up in the next year: WhiteWater Midstream’s Blackcomb pipeline (dashed green line in Figure 2 below), which took a final investment decision (FID) in August 2024 and will add 2.5 Bcf/d of capacity to the Agua Dulce hub in South Texas, and Energy Transfer’s Hugh Brinson Pipeline (dashed blue line), which will provide at least 1.5 Bcf/d of capacity to the Dallas area. In addition, Kinder Morgan will expand its Gulf Coast Express (GCX; red line) by 570 MMcf/d to move about 2.57 Bcf/d to Agua Dulce. The incremental capacity provided by these projects is needed soon, but as our forecasts indicate, capacity constraints could continue until these pipelines come online in 2026.
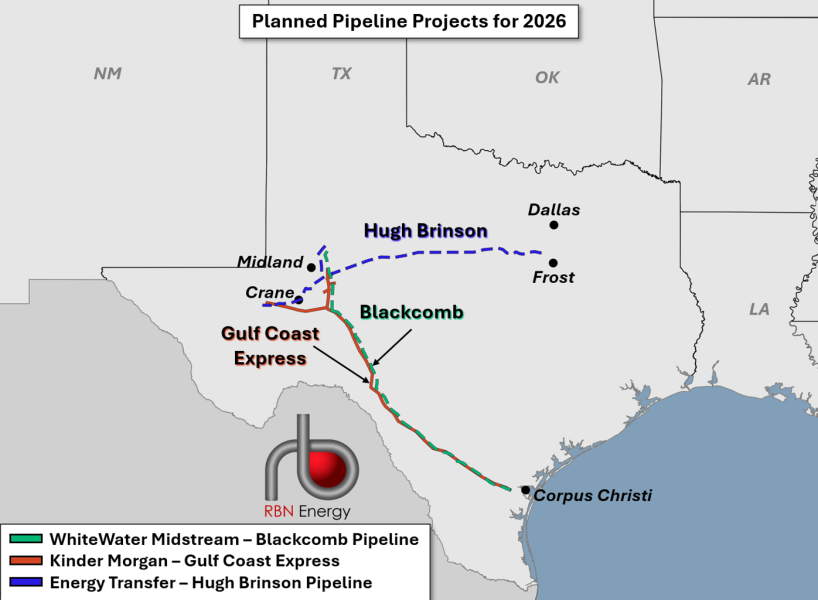
Figure 2. Planned Pipeline Projects for 2026. Source: RBN
To fully understand what’s happening in the Permian and create your own market insights, you must first know the fundamentals.
Warning: Today’s blog is a blatant advertorial for our upcoming Natural Gas Master Class, an online event set for Thursday, October 23. Participants will learn how to read and understand pipeline data, conduct flow analysis, model production and forecast regional dynamics, all using real-life examples.
The Natural Gas Master Class
Whether you’re new to the natural gas sector or looking to deepen your understanding of a particular market, RBN has you covered. Our Natural Gas Master Class will teach you, among other things, how to find a pipeline’s maintenance schedule, how to read a pipeline’s flows, and how to find the key infrastructure points vital for understanding a specific market. Each pipeline reports data in its own way, so it takes consistent attention and some know-how to find what matters most. Being able to follow both the numbers and the real-time operating events on these boards is crucial because flows and prices can shift rapidly when demand spikes, supply drops, or new projects are launched.
Let’s use a real-world example to demonstrate what you can learn from pipeline flows. Figure 3 below shows feedgas intake at Freeport LNG and what happens to flows when the terminal has an unplanned outage. When things are running smoothly (black circles), timely (green line), intraday (yellow and orange lines) and final flow volumes (blue line) remain closely aligned, with only minor tweaks between what’s planned and what happens. (Timely flows refer to day-ahead scheduled nominations submitted before the main, early deadline. Intraday flows capture adjustments made after the initial nominations. Final natural gas flows reflect the actual delivery volumes that reach the facility over the complete gas day.) But when Freeport suddenly trips offline (indicated by the arrows), operators must adjust their flows, making it easy to spot the timing and scale of a disruption. (Flows almost always bounce back within a couple of days.) That instant visibility means market watchers can quickly update demand forecasts and pricing assumptions, instead of waiting for official statements or lagged news reports.
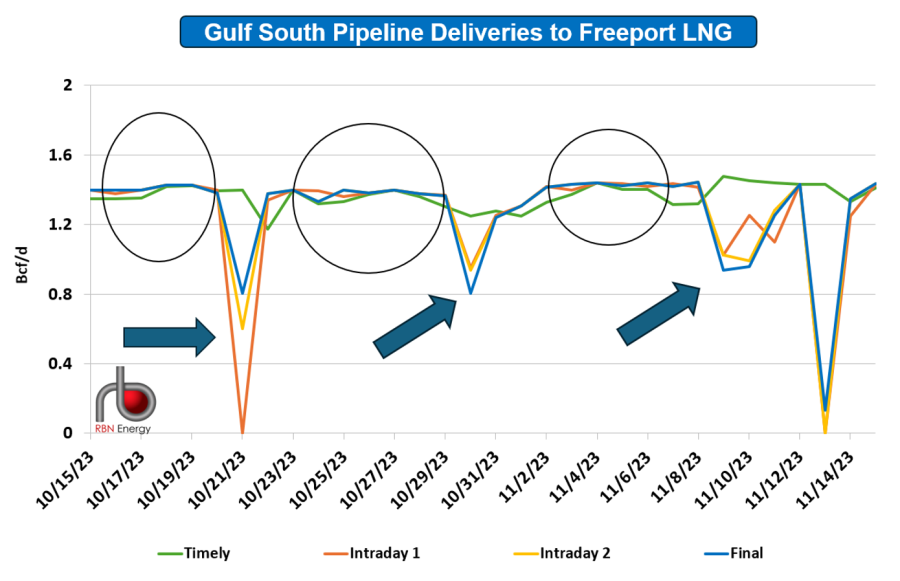
Figure 3: Gulf South Pipeline Deliveries to Freeport LNG. Source: RBN
Using a combination of information provided by the pipelines and flow analysis, we’re able to piece the market together, acting as a detective to discover where the gas is headed and if there are disruptions related to congestion, outages or weather. Once we understand how a market works, we can make powerful insights about the future of the market under a variety of scenarios. It’s also important to note that the U.S. has the most robust pipeline grid in the world, and a huge portion of that cross-country gas movement is public, so when you know how to read the data, you gain powerful insights into the larger natural gas market. Combine that knowledge with weather and price data and you can spot regional market trends, predict changes and see the impact of new infrastructure.
One key piece of new infrastructure that we’ve kept a close eye on since it started is MVP, a 2-Bcf/d pipeline that finally came online last summer in the Appalachian Basin after a lengthy legal battle (see Rescue Me). The pipeline (aqua line in Figure 4 below) runs from the Southwest portion of the Marcellus in West Virginia to Transco Station 165 (black dot) at the Virginia-North Carolina border. That part of the Southeast is one of the most pipeline-constrained areas in the country, so rather than allowing for increased Appalachian production, the pipeline has mostly caused intra-region competition between northeast Pennsylvania, which is also served by Transco (purple line), and the southwest Marcellus.
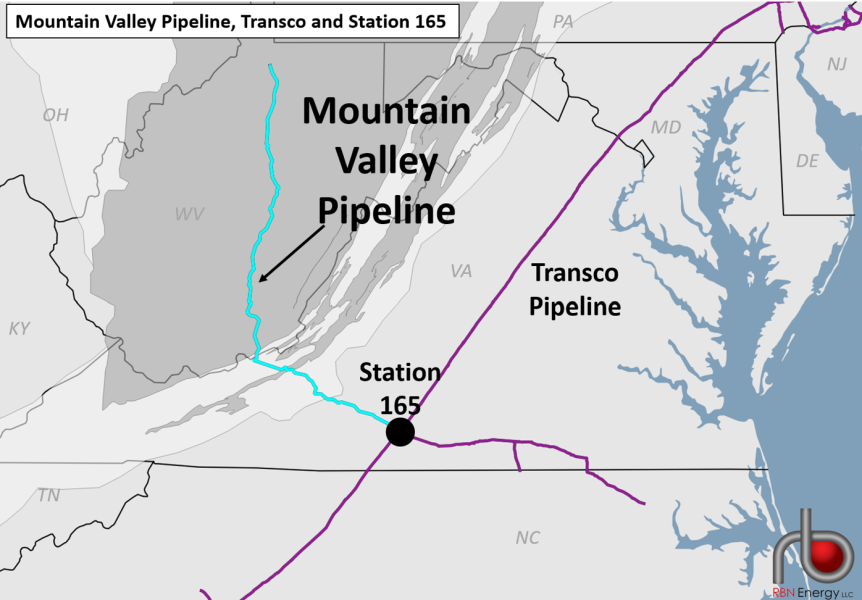
Figure 4. Mountain Valley Pipeline, Transco and Station 165. Source. RBN
Using flow data, we can see what’s happened to both supply areas and overall outflows from Appalachia to the Southeast since MVP came online. We can also predict what will happen as more debottlenecking pipeline projects in the Southeast begin service. While MVP initially created a shift, rather than an increase, in natural gas flows, the debottlenecking projects now in operation have led flows through Station 165 to increase by 300 MMcf/d year-over-year, according to our NATGAS Appalachia report, and Appalachian production has been at an all-time high.
With the pipeline data in hand and flow analysis completed, we can start to model production, identify demand patterns and recognize market dislocations that impact balances and prices. One of the first examples we’ll explore in our Natural Gas Master Class is the Rockies Express Pipeline (REX), a critical outlet that allowed Rockies gas to access markets in the Midwest and Northeast, which at the time of its completion in 2009 had little local supply and high demand. But REX’s operational in-service coincided with the Shale Revolution in the Appalachian Basin. REX’s owners ultimately decided to rework the pipeline to enable Marcellus/Utica gas to move west, making the eastern and then middle sections of the pipeline bidirectional.
The pipeline’s now fully bidirectional design allows it to respond to shifting supply and demand, and it, together with the Ruby Pipeline, has evolved into something like a huge cross-country “header” system for gas across the northern half of the country. During the upcoming Master Class, we’ll use REX to discuss how to construct regional balances, interpret their implications for flows and pricing, and apply these insights to anticipate market outcomes.
Finally, we recognize that understanding existing regional dynamics will help forecast future market impacts. Supply growth means new infrastructure such as processing plants, storage and pipelines. U.S. export growth, including exports to Mexico and more Gulf Coast LNG, will pull gas from all directions and spark fresh pipeline construction. Supply and demand will continue to drive fundamentals, with weather factors providing an additional variable, and regulatory changes always loom.
Energy markets do not work perfectly. Information gaps exist, and prices never reflect every available fact. Plenty of data is out there, but the challenge lies in knowing what matters most and how to interpret it. Our goal is to make sure you’ll be in better shape to pull meaning out of the complex natural gas market data.
At RBN’s upcoming Natural Gas Master Class, we’ll be taking our deepest dive ever into natural gas flow analysis and pipeline modeling — the type of analysis we demonstrated in today’s blog. For more information about the one-day conference, click here.

“Missing Piece” was written by James Keogh (Vance Joy) and Joel Little. It appears as the third song on side one of Vance Joy’s third studio album, In Our Own Sweet Time. Released as a single in May 2021, it went to #4 on the Billboard Rock & Alternative Airplay and #19 on the Billboard Hot Rock & Alternative Singles charts. It has been certified Gold by the Recording Industry Association of America. Joy said the song is about “being separated from someone you love.” It made its television debut in the 17th season of Grey’s Anatomy. The song won “Best Video” at the 2021 ARIA Music Awards. Personnel on the record were: Vance Joy (vocals, guitar), Edwin White (drums) and Joel Little (bass, programming).
In Our Own Sweet Time was recorded in 2021 at Joy’s home studio in Barcelona, where he lived at the time. Self-produced, along with his songwriting collaborators, the album was released in June 2022 and went to #81 on the Billboard 200 Albums chart. Five singles were released from the LP.
Vance Joy (James Keogh) is an Australian singer, songwriter and musician. He released his first single, “From Afar,” in January 2013. His song “Riptide,” released in March 2013, was featured in a U.S. GoPro television commercial, resulting in a deal with Atlantic Records. It became a worldwide hit, being certified 10x Platinum by the RIAA. He has released three studio albums, two live albums, an EP, and 22 singles. Joy resides with his wife and family in Shelburne, VT. He continues to record and tour and is on tour through September in the U.S. He plays the Harvest Rock Festival in Adelaide, Australia, in October.


