Growth for growth’s sake. In the early years of the Shale Revolution, that’s what it was all about. Backed by billions of dollars in Wall Street borrowings, E&Ps plowed vast piles of cash into increasing production. It was the era of “Drill baby drill!” And we all know what happened next. Rabid production growth contributed to oversupply and crude oil prices crashed. But resilient E&Ps clawed their way back by adopting what we now know as capital discipline, initially in fits and starts. Then, after the COVID price meltdown, they went all-in, elevating free cash flow generation to Job #1 and returning a significant portion of cash flow to shareholders. It worked! Financial markets started to think of E&Ps more as yield vehicles than growth plays. But it is in the DNA of oil and gas producers to grow. And now that U.S. crude prices are above $85/bbl, could we see a backslide toward organic growth — a 2024 rendition of “Drill baby drill”? In today’s RBN blog, we’ll explore the historical context of E&Ps’ transition to capital discipline and what it tells us about what’s coming next.
Let’s look at how we got to where we are today, focusing primarily on the oil market timeline. Way back before shale, the U.S. oil and gas industry had been struggling through a long period of stagnancy and decline. But in the late 2000s, the Shale Revolution changed everything. New, more effective techniques for optimizing the combo of horizontal drilling and hydraulic fracturing enabled producers to wring increasing volumes of natural gas from previously impenetrable shale and, soon thereafter, the same approaches worked for crude oil. Talk about game-changers!
E&Ps, backed by those billions in Wall Street borrowings unleashed the “Drill baby drill” era. By 2014, nearly 2,000 drilling rigs were active in the U.S., with most in shale plays. Crude oil production was topping 8 MMb/d and Lower 48 gas production was exceeding 70 Bcf/d. Producers were successful — too successful, in fact. The excessive production growth contributed to oversupply, and the predictable happened: The bottom fell out, for both gas and crude. On the crude side of the ledger, between June 2014 and February 2016, oil prices fell from about $100/bbl to average just over $25/bbl, and energy investors voted with their feet. The S&P E&P Index (formally called the S&P Oil & Gas Exploration & Production Select Industry Index), which had tripled to just over 12,400 in the five-plus years before the crash, plummeted to about 3,700.
And even though the 40 large, publicly traded independent U.S. E&Ps we track at RBN (see Good Enough – E&P 2023 Profits) slashed their 2015 capex by 40% — from $130 billion in 2014 to $78 billion — that number was still a whopping 27% ABOVE their 2015 cash flow, even higher than their 14% “over-spend” in 2014. Yup, growth is imbedded in producer DNA, even when faced with adverse market conditions.
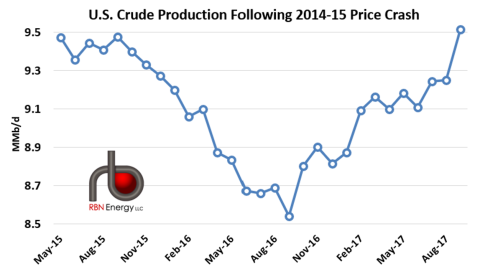
At the time, wishful thinking was that prices would rebound quickly, but it was not to be. As prices continued to wallow below $50/bbl in 2016, the first authentic phase of capital discipline started to take hold. In that year, E&Ps halved their capex to $38 billion, or only 80% of their 2016 cash flow, their rig counts plummeted, and they worked feverishly to divest their non-core assets. The amazing thing was, production didn’t really suffer that much and, as shown in Figure 1 below, was back to pre-crash levels in 18 months. After years of fine-tuning their drilling-and-completion techniques, producer productivity was firing on all cylinders — longer laterals, more stages per well, more frac sand, etc.
Figure 1. U.S. Crude Oil Production After the 2014-15 Price Crash. Source: EIA
Join Backstage Pass to Read Full Article


