The current forward curve (June 9,2014) for CME NYMEX Henry Hub gas futures shows prices at $4.645/MMBtu for July 2014 then increasing through January 2015 to $4.776/MMBtu before falling back to $4.636/MMBtu at the end of next winter in March 2015. Then they take a nosedive and drop 48 cents in April 2015. From that point out forward curve prices are lower than they have been over the past 6 years – falling $1.24/MMBtu lower than last year’s curve at this time by the end of 2023. And the curve is flat - seasonality in today’s curves is also a shadow of it’s former self. Today we look at natural gas forward curves over the past six years.
The chart in Figure #1 below shows six forward curves for CME NYMEX settlement (end of day) data for the natural gas futures contract based on delivery to Henry Hub, LA. Each of the curves is for one day in the first week of June during the years 2009 to 2014. The latest curve (red line) is for June 5, 2014. Time periods are shown along the bottom axis – each of the curves has data points for 150 delivery months out into the future, starting in July of the curve year and going out 12 years and six months. Thus the first curve (light blue) for 2009 starts in July 2009 and goes out to December 2021 while the most recent curve for 2014 starts in July 2014 and ends in December 2026.
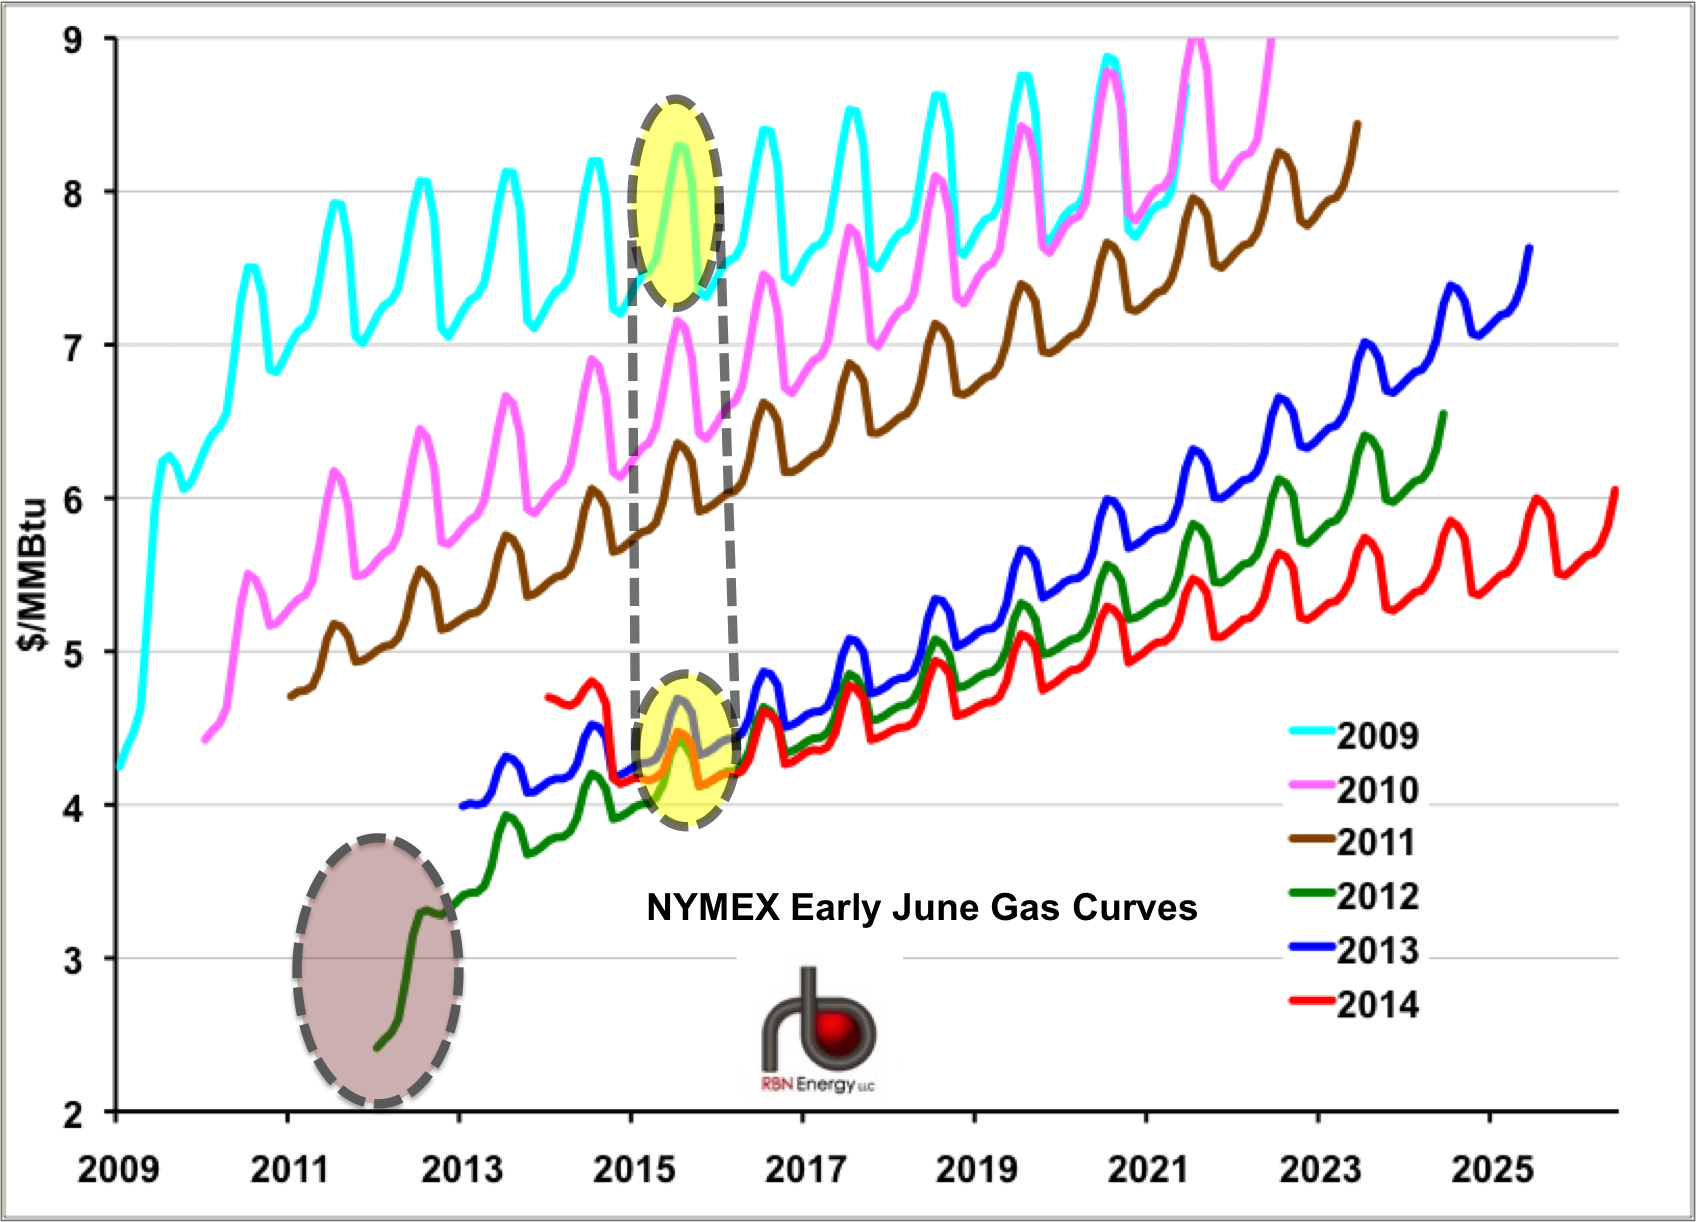
Figure #1
Source: CME data from Morningstar (Click to Enlarge)
It is important to remember that these forward curves are not forecasts – they represent the value of futures contracts for deliveries out into the future - typically governed by market sentiment on the day. Not all of these 150 delivery month contracts out into the future are necessarily traded each day, but if futures market participants hold open contracts then the CME provide a settlement price each trading day. Looking at six different historic curves like this provides a snapshot of the history of gas prices for the past six years. You can see the range of prices that natural gas futures have traded at (just in the month of June, don’t forget). The lowest value on the chart is $2.40/MMBtu for the July 2012 contract in June 2012 (green line in the brown shaded circle) – that was a couple of months after gas prices crashed below $2/MMBtu in 2012 following the “non-winter” of 2011-2012 and fears that there would not be enough demand to soak up surging shale gas supplies. That year the reality of bounteous shale supplies sunk in and even though power generators burned up a lot more gas at $2/MMBtu there was a step fall in gas market prices. You can see that the 2012 curve (green line) is much lower than the 2011 curve (brown line) – on average prices for the 2012 curve are $2/MMBtu lower than for 2011. Since 2012, gas prices have traded in a lower range so that instead of values in the $4-$9/MMBtu range for 2009-2011 prices from 2012 to 2014 have been in the $2-$7/MMBtu range. For the record the highest settlement value on our chart is $9.01/MMBtu at the end of the 2010 curve (pink line) for delivery in December 2022. Bet producers wished they had that contract hedged!
About the song
“In the Curve” is a hard to find bonus track on the 2007 Album “Emotionalism” that brought country rock band “The Avett Brothers” to national attention.