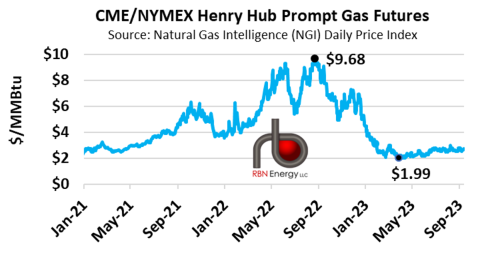
The CME/NYMEX Henry Hub prompt natural gas futures prices have been relatively rangebound this injection season and have averaged around $2.60/MMBtu since June — a third or less of where prices stood during the same period last year, in the $7-$9/MMBtu range, and at or below most natural gas producers’ breakeven costs. Yet, this is a much rosier scenario than it could have been considering that the first quarter of 2023 was one of the most bearish in over a decade and led to a massive storage surplus vs. last year that persisted through much of the summer. Since setting the year-to-date monthly average low of $2.19/MMBtu in April, prompt futures rose to an average of nearly $2.50/MMBtu in June, ~$2.65/MMBtu in July and August, and have mostly stayed in the $2.50-$2.75 range in September to date. In today’s RBN blog, we break down the factors that kept prices from unraveling this injection season to date and the implications for the rest of the shoulder season.
In our Top 10 Prognostications of 2023 blog, published on the first business day of the year, we predicted that the 2023 hiatus on new LNG export capacity additions would trigger an oversupplied gas market this year — the kind that defined the Shale Era — albeit the last one we’re likely to see for some time. Production had rebounded from December’s Winter Storm Elliott to the 100-Bcf-plus level, which was more than 6 Bcf/d higher than a year ago at the time. Freeport LNG was still offline following a fire in early June 2022, the timing of its return was uncertain, and the next tranche of new export capacity was not due for another year at the earliest. But, as it turned out, LNG wasn’t the only — or even the biggest — bearish demand factor that trounced gas prices early this year. What we didn’t know when we published that blog was that January and February — typically among the coldest, highest-demand months of the year — would be among the warmest on record, particularly for the Eastern U.S., and result in one of the most bearish starts to a new year that the market had seen in over a decade (which we chronicled in The Final Countdown).
Figure 1. CME/NYMEX Henry Hub Prompt Gas Futures Price History. Source: Bloomberg
Join Backstage Pass to Read Full Article


