As U.S. LNG exports play an increasing role in the global market, the U.S. will not only be exporting its vast natural gas supplies but also to a degree its market realities — namely, the risks, opportunities and, at times, volatility of a highly liquid, fungible and economically-driven spot market. The global LNG market also has shifted toward more flexible and spot-oriented trade, opening the window for some ad lib wheeling and dealing based on the prevailing economic conditions at any given time. These two factors together will come with significant implications across the supply chain — from the producing basins to the pipeline transport routes and from the export terminals to the destination markets they are serving. This month, with feedgas receipts at Sabine Pass LNG down and an explosion on a key supply route from Appalachia to Louisiana, we are starting to see how this integration of the U.S. and global markets is likely to play out. To help you keep up with this complicated dynamic and extrapolate the big-picture impacts, today we introduce RBN’s new LNG Voyager Report, featuring a comprehensive, pipe-to-port-to-destination approach to understanding how U.S. LNG fits into the global market.
For years, we’ve been talking about the looming impact of U.S. exports on global LNG markets, and at the same time, contemplating what those exports will mean for the markets here, in North America. Now, that’s a reality. In the past three years, U.S. LNG exports have gone from being non-existent to an average of 3.0 Bcf/d. In that time, the new demand source — currently from just five liquefaction trains, four at Cheniere Energy’s Sabine Pass LNG (SPL) in Cameron Parish, LA, and one at Dominion’s Cove Point LNG in Maryland — already has reconfigured pipeline flows all the way from the Northeast and Midwest to the Gulf Coast, as Appalachian and other gas suppliers look for ways to get their gas south, where the lion’s share of the export demand is happening (see Toe Bone Connected to the Foot Bone, and our latest Drill Down report, Down Louisiana Way). In fact, gas flows along entire corridors of pipeline routes that used to flow south-to-north have flipped direction and are flowing gas north-to-south.
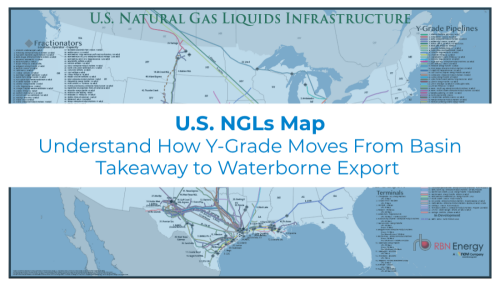
Visualize the infrastructure behind U.S. NGL movement.
The U.S. NGLs Map provides a comprehensive view of the transport, processing, and export networks moving NGLs across the U.S.
This is just the beginning. There are plans to add at least another 11 liquefaction trains along the U.S. Gulf Coast, all due to come online over the next five years. As we discussed in our blog Ship Ahoy!, the current schedule of liquefaction projects suggests U.S. LNG export capacity will approach 10 Bcf/d, or about 76 million tonnes per annum (MTPA), by 2020 and breach 11 Bcf/d (~85 MTPA) by 2023. At that rate, U.S. LNG exports would make up about 20% of the global LNG market share in three years’ time. While some of this will be baseload volumes — moving regardless of price — some of it also will be variable, with the U.S. being the swing, or marginal, supplier. As that happens, global LNG movements will be increasingly susceptible to the inner workings and shifting dynamics of the U.S. gas market.
In recent months, the RBN Team has devoted a great deal of our analytics resources to understanding the knock-on effects of these emerging trends. Given their significance to the market, we’ve developed an all-inclusive fundamentals tool to closely track the metrics, milestones and impacts of these shifts as they unfold. Which brings us to a not-so-subtle advertorial for a new publication we are preparing to launch — the LNG Voyager Report. The weekly report combines fundamental data, graphs and analysis to provide a comprehensive picture of the factors impacting the U.S. LNG supply chain, including upstream natural gas supply trends in the producing basins, including Haynesville, Marcellus/Utica and Permian; pipeline capacity, flows and price dynamics; terminal operations; and destination details. A monthly supplement also provides detailed updates on the liquefaction and pipeline projects that are driving the market shifts, including project timing, capacity contracts and supply contracts.

About the song
"Here I Am (Come and Take Me)" was written by Al Green and Teenie Hodges, and was the second single released from Al Green's sixth studio album Call Me. It was released as a single in June 1973, and reached #10 on the U.S. Billboard Hot 100, and #2 on the U.S. Billboard Hot Soul Singles chart. Produced by Willie Mitchell, the album was recorded at Memphis' Royal Recording Studios in 1972. Widely regarded as Green's masterpiece recording, “Here I am” helped to earn him the title "Last of the Great Soul Singers." The personnel on the record are: Al Green (vocals), Charles Chalmers (background vocals and horn arrangements), Teenie Hodges (guitar), Leroy Hodges (bass), Charles Hodges (organ), Howard Grimes and Al Jackson Jr. (drums), Wayne Jackson (trumpet), Andrew Love (tenor sax), James Mitchell (baritone sax), Archie Turner (piano), and Donna and Sandra Rhodes (background vocals). In 1990, the English reggae/pop band UB40 released its version of "Here I Am," which rose to #7 on the U.S. Billboard Top 100.
Al Green recorded for producer Willie Mitchell's Hi Records in Memphis from 1969 to 1978, during which time he turned out twelve albums, before becoming an ordained minister and focusing on gospel music from 1981 to 1989. He still preaches, schedule permitting, at the Full Gospel Tabernacle, located near Graceland in Memphis. He returned to making secular music in addition to gospel in 1988.
Rolling Stone magazine lists Al Green at #65 in its list of the 100 Greatest Artists of All Time. Green has received eight Soul Gospel Performance Grammy Awards, was inducted into the Rock and Roll Hall of Fame in 1995 and the Gospel Music Hall of Fame in 2004, won a BMI Icon Award in 2004, received a Lifetime Achievement Award at the 2009 BET Awards, and became a Kennedy Center Honors recipient on December 7, 2014.