It’s the first week of March 2013 – the final month of the natural gas winter season. This winter has been colder than last so far reducing the record storage surplus that we started the season with. Natural gas prices have traded in a range between $3.25 and $3.50/MMBtu so far this year. Production continues at or near to record levels however and higher prices will likely reduce gas fired power generation. That means summer demand could be lower than last year and the storage surplus would rebound again. Today we review the current natural gas supply and demand situation.
How Cold is Colder?
The winter of 2012/2013 has definitely been colder than the non-winter of 2011/2012. We can get a good idea of how cold the winter has been against prior years and against a 30 year normal by looking at population weighted Heating Degree Day (HDD) data from the National Oceanic and Atmospheric Administration (NOAA). We have previously discussed HDD data and gone through an example of the calculation for Cooling Degree Days (see Under the Weather – Cooling Degree Days). Recall that each HDD represents one degree Fahrenheit below 65. Chart #1 below on the left shows US HDD data for 2011 (blue line) and 2012 (red line).
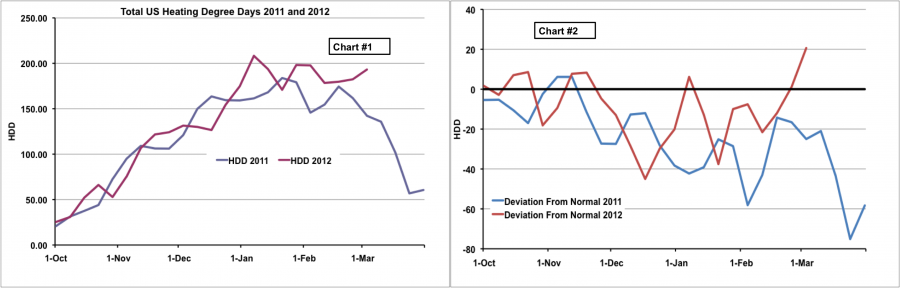
Source: NOAA Data from Morningstar (Click to Enlarge)
The 2012 winter HDD (red line) tracked 2011 winter HDD (blue line) levels from October through December and then in January the 2012 HDD level increased above 2011 and has pretty much stayed higher since then. This is not entirely unexpected given that the winter of 2011/2012 was famously mild. Chart #2 on the right shows the HDD deviation from 30-year normal levels for this winter and last. You can see clearly that the 2011 winter (blue line) is consistently lower (indicating warmer) than normal (the black zero line is normal). The 2012 winter was relatively warm compared to the normal before the end of December but a cold spell in the second half of February has meant that this winter is likely to finish colder than usual. The colder weather has increased the demand for natural gas used in home heating – helping to reduce the storage surplus.
That storage surplus started the year at record levels with a surplus 0.75 Trillion cubic feet (Tcf) above the 5 year average in March 2012 according to the Energy Information Administration (EIA). The storage surplus last year was caused by a combination of rapidly increasing shale gas production and limited demand during the non-winter of 2011/2012. The chart below shows EIA total US storage levels since January 2011. The actual storage level (red line) followed the 5 year average (blue line) through October 2011. Then the combination of a mild winter and increasing production led to a large storage surplus by the end of winter 2012. The surplus led to a natural gas price collapse to lower than $2/MMBtu values in April 2012. The storage surplus hung over the market for the remainder of 2012 and has only begun to recede since the start of this year. The current storage surplus over the 5 year average is 0.3 Tcf. Because last March was so warm just normal temperatures this month will see the surplus reduce because demand will be higher than 2011.
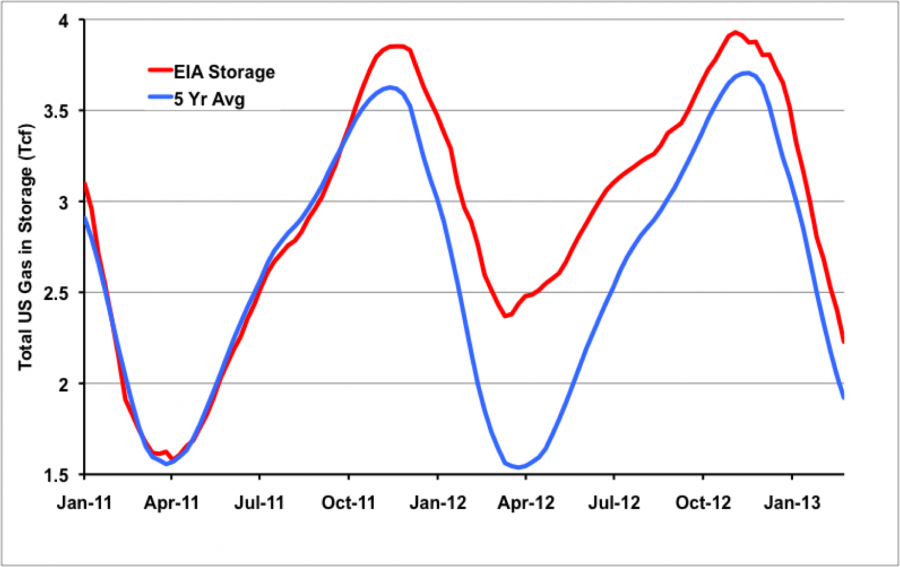
Source: EIA Data from Morningstar (Click to Enlarge)
The recovery to something like a normal surplus and a few reassuring cold spells during January and February this year appear to have supported higher prices during the 2012/2013 winter. Since October 2012 prices have traded in a range between $3.25/MMBtu and $3.50/MMBtu except for a brief rally to $3.90/MMBtu in November. NYMEX Henry Hub natural gas futures settled at $3.529/MMBtu yesterday (Monday March 4, 2013). With the storage surplus looking set to reduce further by the end of March prices are unlikely to fall this April to the levels that we saw last year.
Whatever happens to the weather this month the fate of natural gas prices this summer will have a lot to do with the levels of production. According to Bentek’s Cell Model production numbers, natural gas production reached a 2013 record on Feb 4th at 64.3 Bcf/d and has since fallen off to 64.1 Bcf/d. That slight fall in production is more likely the result of wellhead freeze offs caused by colder winter weather in the western US than it is any reluctance on the part of producers. Freeze offs cause production curtailment when the wellhead equipment is not insulated (see Cold as Ice). Gas production is expected to climb again in 2013 as new natural gas liquids (NGL) processing capacity comes online and brings associated gas with it into the market. Meanwhile ethane rejection is also increasing natural gas supplies. Ethane rejection occurs when low ethane prices mean it is more economical for NGL fractionators to leave ethane in the gas stream and sell it as natural gas. BENTEK estimated ethane rejection at 160 Mb/d in mid-February. Using the RBN Energy “Hack Model” of ethane rejection we estimate that would result in approximately 0.25 Bcf/d of extra natural gas hitting the market (see Tailgate Blues – Hacking a Model of Ethane Rejection).
According to Baker Hughes the number of gas drilling rigs has been flat since hitting a low of 413 in November 2012. That low followed a dramatic fall from an October 2011 high of 934. As we have previously discussed the rig count is less meaningful nowadays as an indicator of gas production. Productivity improvements over the past few have led to production with fewer rigs (see Kinda Spooky Revisited). The level rig count since last November, particularly with increases in horizontal rigs at 65% of the oil+gas total, indicates that new drilling continues and that production volumes will not likely fall off any time soon.
Of course, the natural gas market requires a balance between supply and demand. Until the government grants additional permits to export natural gas as LNG - a decision not expected to take effect before 2015 – increased gas production has to be consumed by new demand. Last year that feat was accomplished by an increase in natural gas power burn for generation. Average power burn in 2012 was 4 Bcf/d higher than for 2011 according to Bentek. The EIA reported in February that natural gas net generation rose 21 percent from 2011 to 2012 due to low natural gas prices relative to coal. With natural gas prices about $1.50/MMBtu higher this March than they were last April all indications are that coal prices will compete for marginal power generation. However, it is possible that a combination of environmental considerations and last year’s positive experiences with natural gas could combine to encourage more gas fired generation, even with somewhat higher natural gas prices. We’ll all be watching carefully for signs of that development.
As we move into March 2013 and the winter draws to a close, the weather has been kind to natural gas by providing a boost to demand and prices. The increased demand has pared back the huge storage surplus that we started with at the end of last winter in April 2012. Since then prices have recovered from 10 year lows and have traded in a range between $3.25 and $3.50/MMBtu. Once the winter weather is over all eyes will be on power burn to see if the record natural gas consumption by generators last year will be repeated.
|
Each business day RBN Energy releases the Daily Energy Post covering some aspect of energy market dynamics. Receive the morning RBN Energy email by signing up for the RBN Energy Network. |
Ruby Tuesday was released by the Rolling Stones in 1967


