

More than 70 new data centers are under development in Virginia, which is already the world’s leading hub for the massive, high-tech facilities. But given the rapid pace of the buildout and the challenges that come with it, it’s probably no surprise that not everyone in the Old Dominion State is as enthusiastic about data centers as they once were. In today’s RBN blog, we’ll look at some of the biggest data centers in the works and discuss their path forward.
Analyst Insights are unique perspectives provided by RBN analysts about energy markets developments. The Insights may cover a wide range of information, such as industry trends, fundamentals, competitive landscape, or other market rumblings. These Insights are designed to be bite-size but punchy analysis so that readers can stay abreast of the most important market changes.
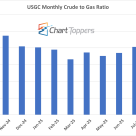
The monthly NYMEX crude-to-gas ratio for September 2025 stands at 21.4, where crude was $63.81/bbl and gas was $2.98/MMbtu, a slight decline from August’s 22.1.
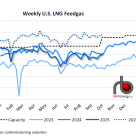
U.S. LNG feedgas demand averaged 15.4 Bcf/d last week (see blue-dotted line in figure below), up 0.1 Bcf/d from the previous week despite lower intake at Cove Point.
West Texas Intermediate (WTI) is the benchmark price for essentially all crude produced in the U.S. But few crudes are actually priced at the WTI level. Most are subject to some kind of discount based on location, quality or competitive conditions. And that means that producers and royalty owners rarely realize a WTI price.
Last Friday we began to delve into crude oil pricing in the Bakken by explaining crude oil postings. Today’s blog is the second in a series designed to uncover how crude is priced, what the transportation costs are and how refiners determine the profitability of processing one crude versus another. In Part II of our tutorial on crude oil pricing, we compare posted prices with the pipeline hub trading markets for Bakken crude at Clearbrook, Minnesota and Guernsey, Wyoming.
With natural gas storage at record levels in early June, it looks like it’s going to be a long summer for gas producers hoping for better prices. The most important factor will be hot weather, or lack thereof. Temperatures this summer will have a significant impact on how much of that gas in storage is put to use for electric power generation. In today’s blog we’ll work through the degree day numbers and explain how a milder than usual summer could impact storage levels.

In just over a month, purity ethane prices in Mont Belvieu are off 41%, falling from 50 cnts/gal on 4/30 to 29 cnts/gal on Friday, 6/8. During the same period, non-TET propane was down 35% from 116 cnts/gal to 75 cnts/gal (see left graph, below). Last week when we looked at petrochemical feedstock economics, propane was the preferred feedstock for the first time in years. But a couple of days later that relationship flipped back to ethane. At first glance, that seems strange. Both ethane and propane increased during the first half of the week, then came back off (see right graph). But feedstock economics went from favoring propane by more than a nickel per pound of ethylene to favoring ethane by just over a penny on Friday. To understand how and why this shift happened we’ll need to break out the spreadsheets again.

Lots of people talk about the price of West Texas Intermediate crude oil at Cushing, OK. But few producers and royalty owners receive that price. In today’s blog we delve into the secret black art of crude oil pricing, focusing on the Bakken. In Part I of our tutorial on crude oil pricing we will cover the mysteries of crude oil “postings” – which is one of the two major mechanisms that determine the prices paid for crude being produced from the oil rich Bakken shale play. (The other mechanism is spot purchases at major trading hubs, and will be the subject of a later installment.) This blog will be the first in a series designed to uncover how crude is priced, what the transportation costs are and how refiners determine the profitability of processing one crude versus another.

Yesterday natural gas NYMEX futures for July delivery closed at $2.421/MMbtu, down 2.5 cnts. Given where half of our RBN readers thought the market was going at the end of March (see Split Decision), this is a pretty good number. After bottoming out at $1.91/MMbtu, Natgas skyrocketed to $2.74 before drifting back into the mid-$2.40s for the past few days (See graph below). Is this price a signal that we’ve dodged the bullet one more year? That the odds of natural gas storage inventories hitting maximum capacity levels are increasingly unlikely? Clearly we need to look at the Bentek supply/demand numbers once more to get a better understanding of what is going on.

Last week the price of ethylene dropped from the low 50s per pound down to the low 40s. In a big flip-flop, propane has been the preferred feedstock for petrochemical plants on the Gulf Coast for a couple of weeks now (it had been ethane for the most part of the last 3+ years). And the petchem market hit ethane where it hurts, whacking the price down to 29.875 cnts/gal on Friday according to OPIS. A month ago that price was 50 cnts/gal. In October of last year the price was almost $1.00 (see graph below). This is good news for petchems, right? Well, it all depends on the margin that the petchem realizes on the feedstocks that are run. So to figure that out, let’s get to Part III of our series on the economics of petrochemical feedstocks.

EIA NGL natural gas plant production statistics were posted on Wednesday and showed something we have not seen for a few months – a decline in volume. It was not a huge decline. And with the price of Conway ethane in the dog house over the past three months, it was not unexpected. But given the importance of NGLs to both the natural gas and petrochemicals industries these days, it definitely warrants a careful examination of the numbers. We can expect to see this trend to accelerate over the next few months.
Today’s blog posting is from Sandy Fielden titled A Drop in the Ocean? Is the Seaway reversal a non-event or contributor to $87.82 crude?
We'll have more on the ethylene feedstock series here later this week.

Yesterday we started our series on the economics of petrochemical feedstocks. With NGLs driving the natural gas market, it is critically important to understand the factors that influence NGL prices. The #1 factor is the petrochemical market that consumes more than half of all NGL production and 100% of the ethane. In Let’s Get Cracking we did a brief overview of olefin crackers including how they work, what they make and where they are located. We also introduced the fundamental fact of feedstock acquisition of the ethylene cracker industry: the best feedstock is the one that will produce the highest margin possible, after deducting byproduct credits. On the surface this seems simple – just make your product out of the cheapest stuff possible. But below the surface it can get quite complex. Of course, deep dives into energy analytics are what we live for here at RBN, so let’s get into the details.

Natural gas production seems totally dependent on NGLs. In turn, NGLs are highly dependent on petrochemical crackers. How does this work? What could go wrong? That’s the topic of this multi-part series on NGLs in the petrochemical industry. Part I is an overview of the market dynamics involved and will set us up for going deep into the math of petrochemical feedstocks. So let’s get cracking.

The demand for motor gasoline is declining. The volume of ethanol in the gasoline pool is increasing. That means the market needs less gasoline from refineries. Another One Bites the Dust is a common refrain heard in refining circles – referring to the latest refinery shutdown. This week I caught the most succinct explanation of what is going on from Lynn Westfall, EVP of Turner, Mason & Co. out of Dallas. He was speaking at the Platt’s North American Refining & Trading Conference held on Monday and Tuesday of this week. The following are my notes (and color commentary) from Lynn’s presentation. We’ll start with two of his most compelling charts.

Over the past month since the NYMEX natural gas contract hit the low of $1.91/MMbtu, the price has screamed upward by $.83/MMbtu, or 44% to $2.737/MMbtu yesterday, up 3 cnts. That’s a pretty good run. Do the fundamentals really support that price level? What has changed in the supply/demand balance to warrant such a turnaround? Is this price run a head fake? We’ll explore these issues today.

Two weeks ago we took a deep dive into the great 2012-18 ethane debate. Will we make too much of the stuff? Or not? Over the next five years, billions will be spend by the petrochemical industry chasing what promises to be huge margins for conversion of ethane to ethylene. But it will take time to bring most of that capacity online. What happens in the meantime? NGL production from wet shale plays is growing fast. If the ethane cut exceeds the ethylene industry’s capacity to consume the feedstock, then the excess ethane will be ‘rejected’ back into the natural gas stream. When and if this happens, the price of ethane in Mont Belvieu will drop to something near fuel value at the gas processing plant. The debate is whether or not this is likely to happen.

This week I am attending and speaking at the Platts North American Refining and Trading conference. This is without a doubt one of the most dynamic and confusing times in the refining business, with huge opportunities coming from shale and tight oil production colliding with regulatory uncertainty, declining demand and rapidly changing economic conditions in the refining sector.

Overbuild!!! The word strikes at the heart of any midstreamer. Call it the curse of capacity. There is a shortage of capacity to do something, like transport crude oil, or store natural gas, or process ethane. You see the opportunity and jump on it, developing infrastructure where it is needed. But you are not the only smart person out there. Others jump on the opportunity as well. And before you know it…. Overbuild!!! Too much capacity has been built and the economics that supported the new infrastructure have been crushed.
And where do you think the foul word has been used most often lately? You guessed it. That island of capacity shortage, the Bakken. Yes, capacity is still short today. But there are a lot of projects in the works. So many pipeline and rail projects out of the Bakken that an overbuild is being predicted by some of the most knowledgeable folks in that market. In an overcapacity situation it is the high cost alternative that loses out. And that is rail.