
The demand for motor gasoline is declining. The volume of ethanol in the gasoline pool is increasing. That means the market needs less gasoline from refineries. Another One Bites the Dust is a common refrain heard in refining circles – referring to the latest refinery shutdown. This week I caught the most succinct explanation of what is going on from Lynn Westfall, EVP of Turner, Mason & Co. out of Dallas. He was speaking at the Platt’s North American Refining & Trading Conference held on Monday and Tuesday of this week. The following are my notes (and color commentary) from Lynn’s presentation. We’ll start with two of his most compelling charts.
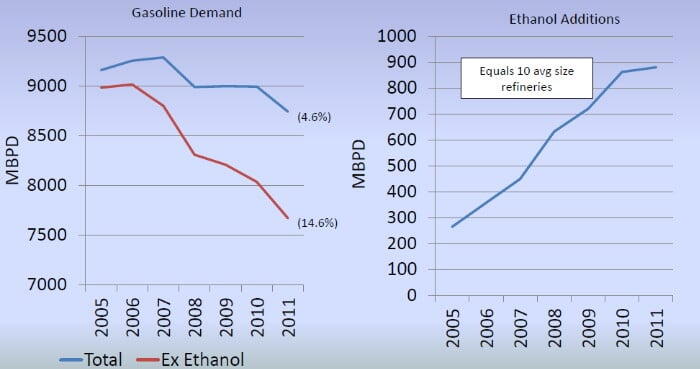
The chart on the left shows that demand for motor gasoline is declining. Between 2005 and 2011, U.S. demand is down 4.6%. That decline is mostly due to vehicle efficiency, combined with somewhat lower miles being driven by the average U.S. car owner. But the demand for the petroleum component of gasoline (i.e. the non-ethanol part of the blend) is down by a much larger number - 14.6%. Almost the entire incremental decline is due to fuel substitution – the ethanol that is being added to the ‘real’ gasoline.
The chart on the right shows how much ethanol is being added. The volume is up from about 250 Mb/d in 2005 to almost 900 Mb/d last year. If you ever wanted evidence that fuel mandates and subsidies work, this is it. It is Lynn’s little text box that I found most stunning. That volume of ethanol is equal to the output of ten average size refineries. I’m sure if you look at these numbers each day this is no big surprise. But it was a surprise for me. Since demand has been declining slightly, it is painfully obvious that the addition of this much ethanol to the gasoline pool has shut down the equivalent of at least 10 refineries. No wonder refineries in the high-cost East Coast market are dropping like flies. They have been backed out by corn.
I’m not going to debate the policy nor the economics associated with ethanol. There are ample venues for that. If you would like to see something that represents my opinions, you can read just about anything from Robert Bryce. (If you want to go deep into Robert’s stuff, see Corn Dog and Biofuels Insanity.)
And to be fair, it was not just corn. We actually increased the capacity of U.S. refineries by about 3% during the same 2005-11 period (see graph on left below). As the efficient refineries expanded and increasing volumes of ethanol were added to the gasoline pool, a number of the less efficient and/or high crude-cost refineries shut down. We detailed the East Coast carnage a couple of weeks ago in Rail it on over to Albany. There were another two refineries on the Gulf Coast and one in the West that bit the dust.
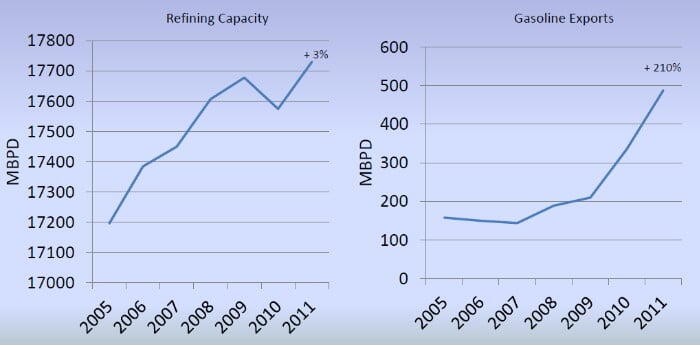
With refining capacity up and the demand for gasoline down, the refiners needed another outlet for their product. And that has been the export market. Check out the graph above on the right. Exports are up 210% during the 2005-11 period. Extrapolating Lynn’s math from the ethanol graph, this has kept the equivalent of eight refineries in business. If the exports had not happened, the refineries that produced these exports would bite the dust. I suspect that would be a bad thing for motor gasoline prices in the areas where these refineries are located. Not so good for employees at those plants either.