EIA NGL natural gas plant production statistics were posted on Wednesday and showed something we have not seen for a few months – a decline in volume. It was not a huge decline. And with the price of Conway ethane in the dog house over the past three months, it was not unexpected. But given the importance of NGLs to both the natural gas and petrochemicals industries these days, it definitely warrants a careful examination of the numbers. We can expect to see this trend to accelerate over the next few months.
The two graphs below show total NGL production through March 2012. On the left, total gas plant production of NGLs has soared from 1.7 MMb/d in January 2009 to 2,388 MB/d in February before dropping back to 2,375 Mb/d in March. That’s not much of a decline. But it is important to note that ethane and propane production dropped 25 Mb/d, offset by a 12 Mb/d increase in natural gasoline. The 25 Mb/d decline was split 2/3rds ethane and 1/3rd propane.
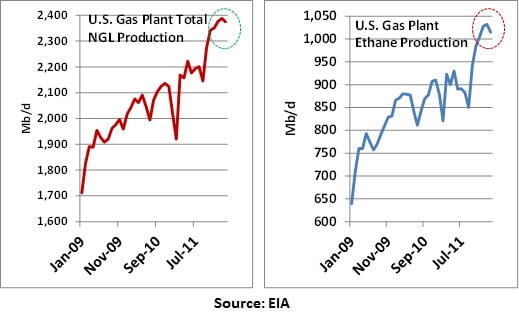
Even more important is where the decline occurred – where it should have occurred. About half of the ethane decline was from PADD 2 (Midcontinent) while the other half was from PADD 3 (Texas/Louisiana/Gulf). The Midcontinent reduction was split equally between ‘Ind, Ill and Ky’ (subpad 2a) and ‘Okla, Kans, Mo’ (subpad 2c). This, boys and girls, is ethane rejection. Barrels that are priced at the plant based on Conway prices are in negative margin territory, and this is our first evidence that processors are reacting as they are supposed to react – Don’t make products that have negative margins.
The numbers also indicate that gas plants are losing propane along with the ethane being rejected. One of the problems with rejecting ethane from older plants is that some propane also disappears into the gas stream with the rejected ethane. The plants can’t make the cuts accurate enough to reject ethane without some propane also going into the residue gas stream. In a lot of market situations, that’s a big problem. But with the current glut of propane (due to 2012 – the Year-Of-No-Winter), perhaps the loss of a little propane is not the end-of-the-world for some of these plants. Thus propane production is down by 7 Mb/d, with more than half of that total from PADD 2.
What is driving this round of rejection? The thing that always drives rejection: price. The graphs below show Conway NGL prices over the past year.
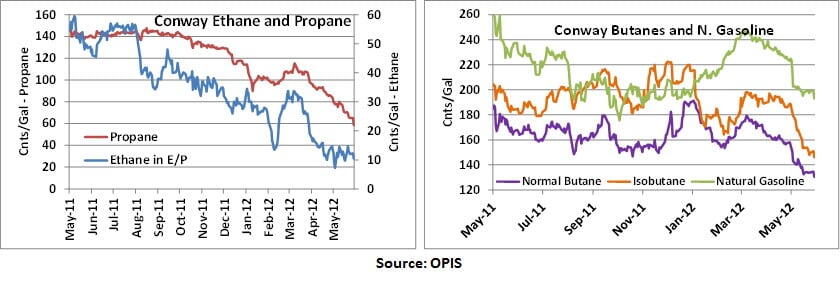
The graph on the left is the price of Conway ethane (in E/P mix) and propane. Ethane is down from about 60 cnts/gal (right axis) to a dime yesterday. Recall that Conway ethane hit 4.5 cnts/gal for a few hours on 5/4/2012. (see Rock Bottom - Zero netback for Conway Ethane in E-P). Propane is down from 140 cnts/gal to 54 cnts/gal yesterday. Those are some big declines.
Fortunately for producers and gas processors, the ‘heavies’ have not been down as much over the past couple of months. Certainly the prices have been hit hard by the decline in crude prices (down $1.29 to $86.53/bbl yesterday). But percentage wise the numbers have not been hit nearly as hard as the lights. Yesterday Conway normal was 123 cnts/gal, Iso was 144 cnts/gal and Natural gasoline was a relatively robust 188 cnts/gal