The end of one year and the start of another provides a perfect opportunity to take stock — in this case, to examine total shareholder returns for the institutional and individual investors holding stock in oil and gas producers. As it turns out, 2023 was a mixed bag, with gas-focused E&Ps generally benefiting from a rebound in gas prices (current and future), oil-focused companies taking a hit, and diversified producers ending up somewhere in between. In today’s RBN blog, we continue our review of E&Ps’ total shareholder returns (TSR) with a look at Gas-Weighted and Diversified E&Ps.
In Part 1 of this two-part series, we said that E&P shareholder returns went from minimally positive to disastrously negative in the decade preceding 2021, driving all but the most masochistic (or pig-headed) investors out of the industry as share prices plunged more than 90%. Then, the E&P sector swore off its growth-at-all-costs mantra and transitioned to a maintenance capital spending strategy to maximize cash flow to repay debt and reward long-suffering shareholders with dividends and share repurchases. The industry quickly won back investors in 2021-22 as cash flows fueled by higher commodity prices post-COVID sent dividends soaring. As a result, the combination of rising equity prices and higher dividends boosted TSR to record levels.
There’s been a mix of good and bad in 2023 — and not much ugly to speak of. The bright spot was from the Gas-Weighted E&Ps, which posted a 7% median gain. The outlook for these companies, whose assets are primarily gas-focused, improved markedly in 2023 as the prospects for continued growth in U.S. LNG exports brightened and futures prices for gas in the second half of the 2020s rose in response. In contrast, TSR for the Oil-Weighted E&Ps declined 3% as oil prices fell toward the end of the year. As you’d expect, the total return for the Diversified E&Ps, whose portfolios are more evenly balanced between oil and gas, fell in between the more focused E&Ps, showing only a modest decline.
In Part 1 we examined the Oil-Weighted peer group in some detail. This time, we shift our attention to Diversified and Gas-Weighted E&Ps. A reminder: TSR is a measure of financial performance that measures the total amount that a stock returns to those who invested in it over a specified period — in our analysis, that period is from the end of 2022 to December 13, 2023. TSR is expressed as a percentage, and is calculated by summing the capital gain or loss from the rise or fall in the stock price and the dividends paid, then dividing that sum by the stock price at the beginning of the period.
Diversified E&Ps
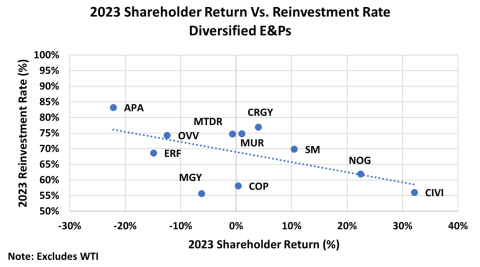
The Diversified E&Ps’ shareholder return declined slightly during 2023. Of the 12 companies in the peer group, six endured declines in TSR, five posted gains and one company was flat. As with the Oil-Weighted E&Ps, the shareholder returns of the Diversified E&Ps (x axis in Figure 1) are negatively correlated with a company’s reinvestment ratio (y axis) — the dotted diagonal line in the chart shows the average correlations.
The two biggest gainers in the Diversified E&Ps were Civitas Resources (CIVI) and Northern Oil & Gas (NOG). CIVI posted the largest shareholder return for the peer group in 2023 (as of December 13) at 32% as the share price went from $57.93 to $68.95 while paying out $7.60/share in dividends. Investors liked the company’s commitment to rewarding shareholders. The producer announced a $1 billion stock buyback in February and made nearly $7 billion in Permian Basin acquisitions during 2023 that will be accretive to shareholder payouts. NOG, in turn, rewarded shareholders with a 23% gain as the share price went from $30.82 to $36.65 and returns were boosted by $1.09/share in dividends. As with Civitas, investors were attracted to Northern’s desire to repatriate monies to shareholders — a move they enhanced by making a few accretive acquisitions during 2023. NOG increased its share-repurchase program back in April and raised its dividend in August.
Figure 1. Diversified E&Ps 2023 Shareholder Returns vs. Reinvestment Rate.
Source: Oil & Gas Financial Analytics, LLC
Join Backstage Pass to Read Full Article


