It’s well understood today that the U.S. natural gas market turned from potential domestic shortages to major LNG exports thanks to the Shale Revolution. What is not so well remembered is that the dramatic shift in the U.S. gas market wasn’t widely understood at the time and took several years to be accepted by the energy industry. In today’s RBN blog, we turn our attention to the beginnings of the Shale Revolution and how it allowed the U.S. to evolve into the world’s largest LNG exporter.
As we discussed in Part 1 of this series, U.S. exports of natural gas in the form of LNG were a mere footnote a decade ago. But that all changed in 2016, when the first shipment of LNG from the Lower 48 set sail from Cheniere Energy's Sabine Pass export terminal in Louisiana. This was the culmination of a remarkable turnaround, not only at Sabine Pass, but for the U.S. natural gas market as a whole. Eight years earlier, Sabine Pass had been completed as an import terminal, as it was projected that the U.S. would face significant shortages of natural gas. Shale turned that business model on its head.
Everybody involved in energy markets knows the shale origin story. The Shale Revolution had its genesis in the Barnett formation near Fort Worth, TX, where George Mitchell, the father of shale, and his team of engineers at Mitchell Energy banged away — literally — at nearly impermeable rock for almost two decades. Their objective was simple: develop the technologies needed to extract what had been thought to be inaccessible natural gas from the massive shale deposits of the Barnett. They finally broke the code, so to speak, in the late 1990s and generally proved out the fracking and horizontal drilling technologies in the early 2000s. The technology was immature, and the cost of production at the time was high relative to traditional wells. But the word got out among risk-taking independent producers, who started looking for other viable shale plays where the technologies could be deployed. But even then, there was no revolution. Just some scrappy independents experimenting with new ways to deploy high-cost drilling-and-completion techniques that had been around for years.
What was needed was a massive catalyst to kick shale into high gear, which is exactly what happened in the form of back-to-back natural disasters. Hurricane Katrina made landfall in southeastern Louisiana in August 2005, devastating the Gulf Coast and wreaking havoc on the offshore natural gas production infrastructure that much of the country relied upon. A second storm, Hurricane Rita, blasted the Gulf Coast less than a month later, just as the industry (and the region) had begun to recover from Katrina.
The two storms’ combined impact devastated the Gulf Coast and took out almost 15% of U.S. natural gas production. With supplies cut so severely, prices skyrocketed to more than $15/MMBtu from the $6-$7/MMBtu range before the storms. With super high prices, those early shale producers saw dramatically improved cash flows and higher rates of return on new drilling activity. With more money to drill wells and substantially better well economics due to the higher prices and increasingly efficient shale drilling, producers did exactly what you would expect: they drilled more shale wells. A lot more. As 2005 drew to a close, shale drilling had its catalyst: high natural gas prices induced by the two hurricanes. It is very unlikely the Shale Revolution would have occurred at anywhere near the rate of change seen in the late 2000s without such a price shock.
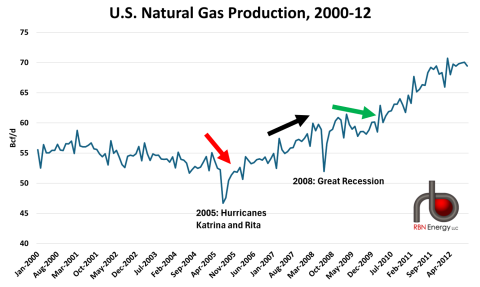
With that as the preamble, we can now look more closely at how things unfolded. Production continued to fall in 2005, as it had since 2001, with the decline aggravated by the output lost due to hurricane damage (red arrow in Figure 1 below). When 2006 production statistics started to register increases, it was generally attributed to the recovery of offshore production from hurricane damage.
Figure 1. U.S. Natural Gas Production, 2000-12. Source: EIA
Join Backstage Pass to Read Full Article


