U.S. Lower 48 natural gas production is averaging a record 74.2 Bcf/d in September to date, according to PointLogic Energy. Meanwhile, CME’s Henry Hub natural gas futures contract has languished at an average of $2.68/MMBtu this month to date, the lowest for any September since 2001. Much of the recent gain in natural gas production has come from new Utica Shale output. In today’s blog, we drill down into the region’s pipeline flow data to see where exactly the growth is coming from, what’s driving it and what it could mean for natural gas supply.
In our latest natural gas supply and demand balance update, Hold Me Tight?, using data from our friends at PointLogic, we showed that U.S. dry gas production has remained relatively flat through the summer despite the dramatic rig count decline earlier this year. We also alluded to the likelihood of oversupply persisting through the summer storage injection season. Subsequently, in Dreaming of a White Christmas, we wrote about the potential for an uptick in production volumes in 4Q2015, enabled by higher demand, higher prices, improved price spreads and more pipeline takeaway capacity. Indications are that any growth would likely come from the Northeast. We mentioned that much of the growth in Northeast production this year to date has come from the Utica Shale in particular, buoyed by new drilling and recent record initial production (IP – the first 30 days of output) numbers from wells primarily targeting dry gas. Today’s blog dives deeper into the Utica production spurt and early indications of where it is headed, starting at the region level and then drilling down into the specific counties driving dry gas production, this time with the help of our friends at Genscape.

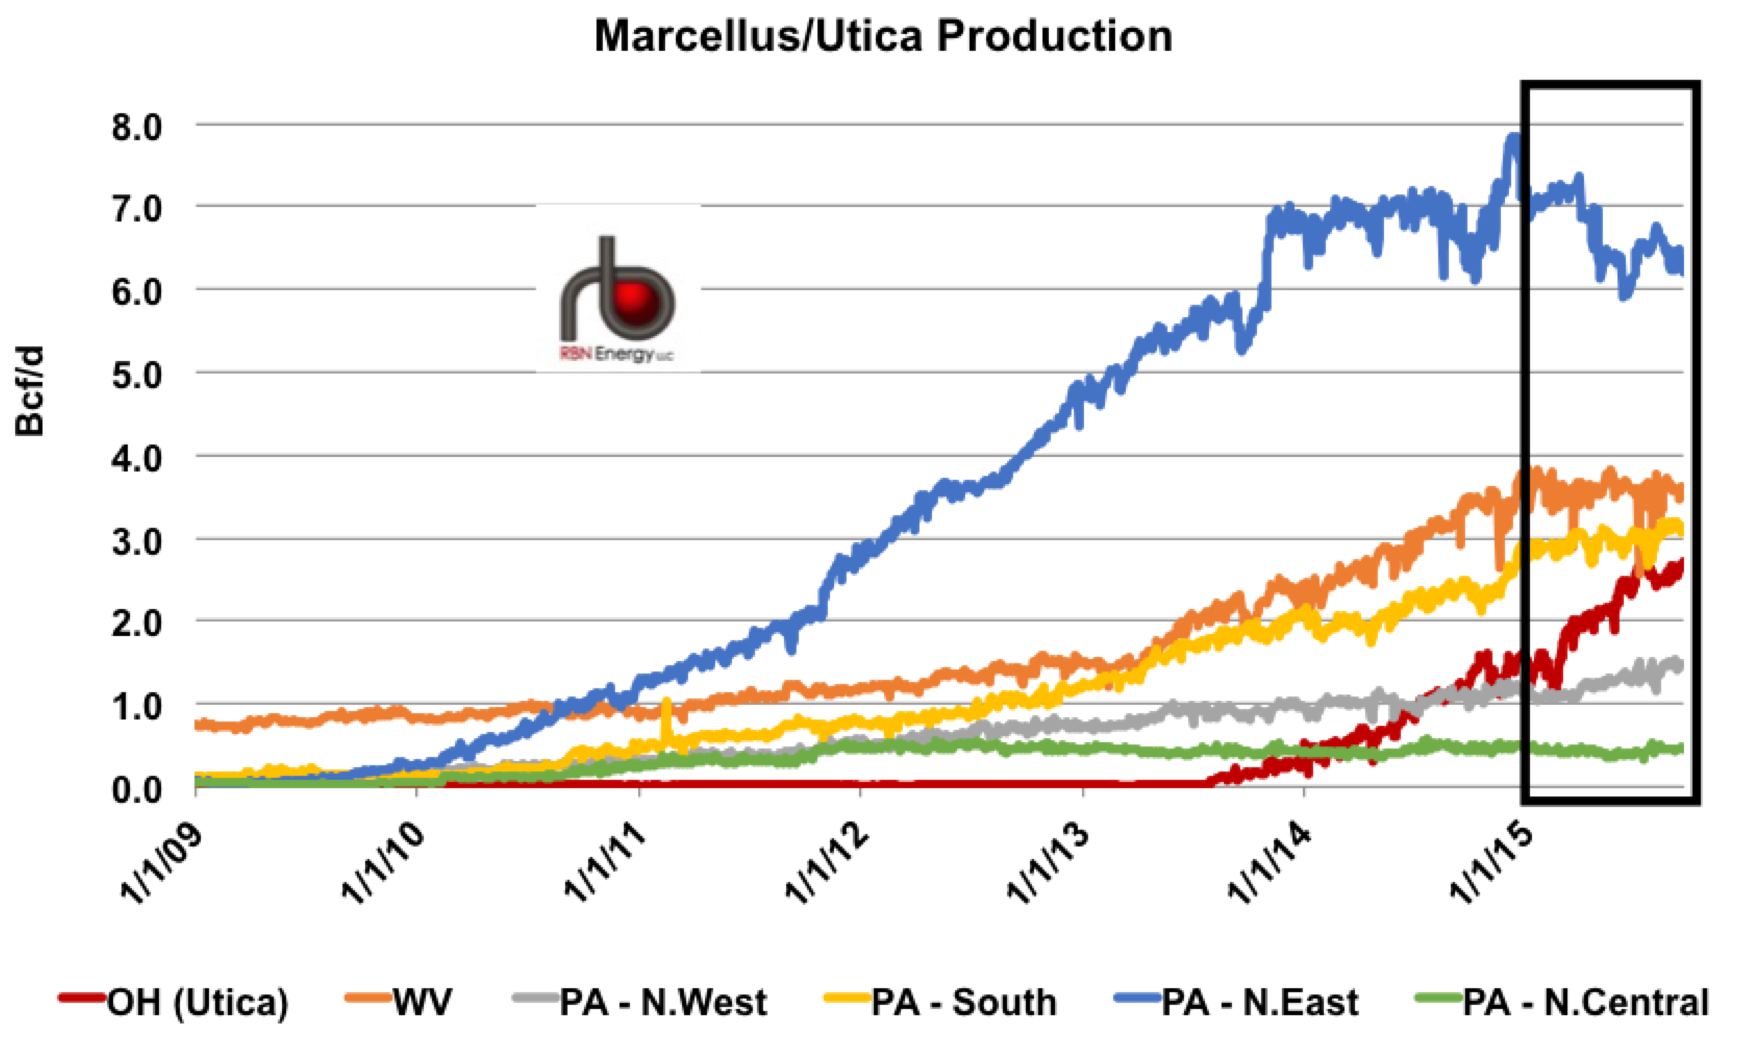
Figure 1; Source: Genscape
Figure 1 shows the relatively rapid rise of Ohio Utica production volumes (red line) in 2015 relative to other regions in the Marcellus, aggregated using State and County level pipeline flow data from Genscape. The graph shows historical production since January 2009 from the six areas that comprise the Marcellus and Utica shale across OH, WV and PA, based on scheduled pipeline receipts of natural gas from gathering systems and processing plants. We split Pennsylvania into four sub-regions, northwest (grey line), south (yellow line), northeast (blue line) and north central (green line). The production trend during 2015 in West Virginia (orange line) and PA N.Central (green line) has been mostly flat to lower. PA N.West (gray line) has shown slight growth since the beginning of the year while PA N.East (blue line) has seen a substantial decline from the effects of shut-ins in that area due to very weak prices. In contrast, Utica production, which is represented in the graph by all receipts in Ohio, has maintained a sharp upward trajectory through this year. Utica production averaged 2.6 Bcf/d in Q3 this year after reaching as high as a record 2.8 Bcf/d on July 16, 2015. The Q3 average is 1.5 Bcf/d higher than a year ago and about 0.4 Bcf/d higher than earlier this year in Q2. Drilling further down into Ohio production, again using Genscape flow data, we find that the majority of recent growth comes from one county – Monroe County, OH. Of the 1.5 Bcf/d increase in Utica volumes, nearly 75% (1.1 Bcf/d) came from Monroe.
Genscape Natural Gas Flow Data at School of Energy!
Are you wondering how to use Genscape data to create the graphic in Figure 1? Well wonder no more. Genscape, our Platinum sponsor at School of Energy - scheduled next week in Houston - has graciously agreed to provide flow data access to our students at the conference and RBN has added a model to our curriculum demonstrating how to use this data to examine northeast natural gas production and demand flows. Click Here For More Information. After the conference, you will walk out the door with trial access to the Genscape system and an RBN model to access it.
Monroe County is at the heart of the dry gas drilling trend in the Ohio Utica. As we mentioned recently in “Hold Me Tight?”, with oil and natural gas liquids (NGLs) trading at significantly lower prices than in 2014, the economics for extracting dry gas are now on par with or even favorable in some cases over those for liquids- or oil-rich plays. Rig counts and producer portfolios indicate a shift in producer resources and drilling activity back toward dry gas plays following the decline in oil and liquids prices. This is particularly the case in the Utica shale, where several dry gas wells have made headlines and earned industry celebrity status for their record initial production (IP) results in recent months. Data from Baker Hughes’ weekly rig count through Sept. 18, 2015 shows that while OH rig counts targeting oil and gas have both declined since late 2014, rigs targeting gas have declined by less. Of the 20 rigs currently operating in Ohio, 14 are targeting natural gas. Of those 14, no less than 5 are located in Monroe County that sits in eastern Ohio along the border with West Virginia in a primarily dry gas “window” of the Utica shale, as indicated by the red shaded area in the map in Figure 2.
About the song
"Dry County" written by Jon Bon Jovi was released in May 1994 as the sixth and final single from Bon Jovi’s 1992 album Keep the Faith. The song is the band's longest released so far, with a length of 9 minutes 52 seconds. A shorter 6-minute version reached #9 in the UK Charts and #1 in Latin America.


Comments
"Utica growth is not unencumbered; dry gas drilling is in early development; it faces pipeline takeaway constraints; and in the yet undeveloped Pennsylvania and West Virginia Utica, it lacks sufficient infrastructure to handle high-pressure dry gas."
Yes, but as a general proposition having the Marcellus overlying the Utica in large part certainly helps. Also, Clarington is in Monroe County. Kind of convenient to have a hub with about the biggest convergence of pipelines imaginable in a key area for the dry gas Utica play. Most of the best wells that I have seen info on to this point are pretty darn close to Clarington. Beats being in Wyoming and trying to get to Clarington."Utica growth is not unencumbered; dry gas drilling is in early development; it faces pipeline takeaway constraints; and in the yet undeveloped Pennsylvania and West Virginia Utica, it lacks sufficient infrastructure to handle high-pressure dry gas."
Yes, but as a general proposition having the Marcellus overlying the Utica in large part certainly helps. Also, Clarington is in Monroe County. Kind of convenient to have a hub with about the biggest convergence of pipelines imaginable in a key area for the dry gas Utica play. Most of the best wells that I have seen info on to this point are pretty darn close to Clarington. Beats being in Wyoming and trying to get to Clarington.