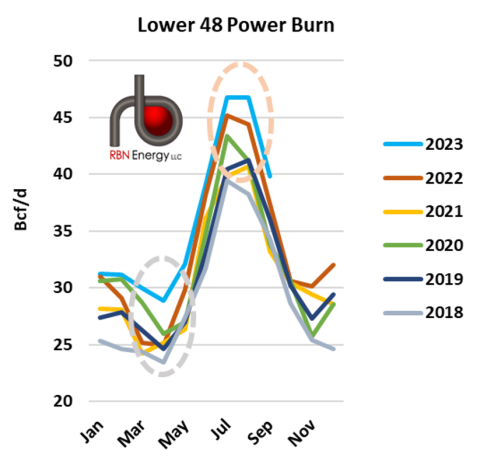
Government forecasts are predicting a sharp drop in natural gas demand in the power sector in the coming decades based on an expectation that the renewable capacity build-out will accelerate and displace other sources. However, forecasts in the past decade have consistently and severely underestimated gas burn for power. In today’s RBN blog, we consider the pitfalls of forecasting gas consumption in a world often focused on pushing a renewables-heavy generation stack.
Natural gas demand in the power sector (i.e., power burn) was not supposed to set records this summer. It was exceptionally hot in the summer of 2022 and power burn hit all-time highs as spiking coal prices kept gas more economical — even as gas prices hit 14-year highs. Given the bullish backdrop set by all that, in the eyes of many, it seemed unlikely that the summer of 2023 would top last year’s lofty power burn levels, barring even hotter weather. Not only is there perpetual, if not always well-placed, optimism surrounding the ability of renewables to displace natural gas, but tight coal market balances had also begun easing and coal prices were falling sharply by early 2023. Sure, more coal power plants were due to retire and gas plant capacity was being added this year. However, renewable capacity additions were expected to steal market share and be the biggest gainers.
For its part, the Energy Information Administration’s (EIA’s) Short-Term Energy Outlook (STEO) as of January forecast gas burn for power declining by an average 1.4 Bcf/d year-on-year in 2023, including an average decline of 0.5 Bcf/d in the first half of the year. The February STEO raised the power burn forecast somewhat and showed a year-on-year increase for the February-April time frame, but it continued to show substantial year-on-year declines through the hottest months. Also, an early February note from the EIA reiterated its expectation that natural gas generation would decline and lose market share overall as new renewables capacity was added.
Figure 1. Lower 48 Power Burn. Source: EIA, RBN U.S. NATGAS Billboard
Join Backstage Pass to Read Full Article


