
U.S. exports of crude oil really took off in 2017, and the exporting pace has only accelerated this fall. In the 10 weeks since mid-September, crude exports have averaged nearly 1.6 million barrels/day, with the vast majority of that oil leaving by ship out of ports along the Gulf Coast. The lifting of the ban on most crude exports two years ago this month and the growth in exports since then have put a spotlight not only on coastal storage facilities, pipelines and marine docks, but also on the huge vessels used to transport crude to far-away destinations. Today, we discuss crude-export vessel configurations, tanker chartering practices, ship-loading challenges and transportation costs.
For more than 40 years — from just after the 1973-74 oil crisis until December 2015 — the U.S. government banned the export of most U.S.-sourced crude oil, the only exceptions being oil from Alaska, oil exported to Canada, some heavy oil from California and very limited trades with Mexico. Before the export ban was lifted two years ago, small volumes of crude were being exported — an average of about 350 Mb/d in 2014 and 465 Mb/d in 2015, mostly to Canada. When the ban became history, exports to countries other than Canada started to ramp up, pushing crude exports to an average of 600 Mb/d in 2016. In 2017, crude exports averaged about 950 Mb/d through mid-September and, as we said, nearly 1.6 MMb/d since then — hitting an all-time high of 2.13 MMb/d the week ended October 27, 2017, according to the Energy Information Administration (EIA). The incremental exports in 2017 have mostly moved to overseas markets on ships; exports to Canada (mostly by pipeline) have held relatively steady.
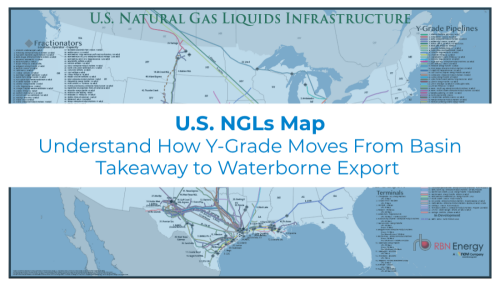
Visualize the infrastructure behind U.S. NGL movement.
The U.S. NGLs Map provides a comprehensive view of the transport, processing, and export networks moving NGLs across the U.S.
The growth in U.S crude export volumes has focused new attention on export-related infrastructure of all kinds, something we are reviewing in our ongoing blog series, Exportin’ From the Free World. Today’s blog zeroes in on the international tanker industry. First, let’s look at the tankers themselves. The primary tanker sizes for moving crude oil on the high seas are:
About the song
“Come Sail Away” was a single from Styx's seventh album: The Grand Illusion, which was released in 1979. The song reached #8 on the Billboard Hot 100, and helped make the album go multi-platinum. “Come Sail Away” was written by Styx lead vocalist and keyboard player Dennis DeYoung.
When The Grand Illusion album was released, Styx was made up of band members DeYoung, Tommy Shaw (lead guitar and background vocals), James Young (rhythm guitar and background vocals), Chuck Panozzo (bass) and John Panozzo (drums). The Panozzo brothers and DeYoung had played in bands together in Chicago since 1964; they put Styx together in 1972. Alabaman Tommy Shaw joined the band in late 1975. Styx continues to tour today with various members — some old and some new.


Comments
There were some Suezmax vessels built that could load/discharge 1 million barrels without having to lighter into Corpus. They could fully load within the 45foot draft limit and also fit under the bridge. I believe the Cap Diamant was one of those vessels
In reply to Suezmax by Greg Sheldon
Yes, the CAP DIAMANT is unique in that it is the only full size (150-170k DWT) Suezmax that has a fully loaded draft under 52 feet (actual draft at summer load line is 51.25 feet). The CAP DIAMONT also meets Corpus Christi's air draft limitation (fully loaded). Based on Corpus Christi data the largest outbound crude oil shipment between January 2016 and September 2017 was just under 900,000 barrels on the CAP PIERRE a Suezmax with a fully loaded draft of 55.9 feet. Therefore, the CAP PIERRE was not fully loaded at 900,000 barrels.
Really enjoyed this piece today. It would be interesting to do an analysis on freight rates from Europe with Brent to those same locations. Then take into account the Brent-WTI spread and get an idea of where those US export bbls are landing and competing with Brent.
Not much Brent is moving to the U.S. these days. I usually look at the landed costs of West African crude oils (Brent-Bonny Light spread is pretty consistent over time). In general the Brent-LLS spread is pretty narrow and we see the parity pricing point for U.S. LTO and West African crudes (of similar API) bouncing between New Orleans and Philadelphia.
A very good article, though simplified down to a comprehendible level in order to get the point across. Shipping is complicated.
The Worldscale is based as you sate, on a round trip from loadport to discharge port and back. Based on this and to the fact that ship owners still can make a positive income on a voyage cost level under WS 100 is related to backhaul or triangular business. Also in a falling market the voyage expenses typically are less than historically stated. I thought both these points should be further highlighted.
As comment number two
If the Producers and Traders started to operate from the West Coast they would be come, just as competitive as the Middle East to the North-East Asia region.
US West Coast does not seem to be an option. Thought the West Coast of Mexico could very well be in the near future.
Map Distance to good protective ports in Southern Baha California – West Coast of Mexico, is more or less the same from West Texas and New Mexico as Corpus Christie is.
If new Infrastructure has to be built anyway, The West Coast Mexico should be the natural way to expand. Both for Crude Oil and for any Gas business. Ports and projects are under development and in discussions with investors and Offtakers. Further volume interest would only speed up this progress. In addition, this area would typically not be weather bond when the US Gulf is under weather siege.
To simply illustrate the distance advantage, please look at the table under. Obviously, it is not only the closeness to the market that is advantageous. The Cost of a canal crossing (Panama or Suez), the no ship restriction (no lightering) and the trading advantage are all present.
Distance from Load ports to Ningbo China:
- If Speed @ 17.5 knots (typical for LNG)
Indian Ocean
Ras Laffan, Qatar Distance 5,688 N Miles or 14 days 5 hours
Dampier, NW Australia Distance 3,100 N Miles or 7 days 18 hours
Dar Es Salam, Tanzania Distance 6,137 N Miles or 15 days 8 hours
North America - Pacific West Coast
Vancouver, Canada Distance 5,137 N Miles or 12 days 20 hours
West Coast, Mexico Distance 6,867 N Miles or 17 days 4 hours
US Gulf
Houston, Texas Distance 10,133 N Miles or 25 days 7 hours via Panama Canal
Houston, Texas Distance 15,008 N Miles or 37 days 12 hours via Cape of Good Hope