Storage, the great balancing mechanism of the natural gas market in North America is heading toward another evolution in its usage, flow patterns and economics. Not too many years ago, natural gas storage was the hottest midstream investment opportunity going, expected to synchronize inbound flotillas of LNG imports with seasonal domestic demand. Winter vs. summer price differentials were wide, prices were volatile and storage economics looked great. When shale gas happened, those differentials evaporated along with storage economics. Today another phase looms for natural gas storage as Marcellus and now Utica production ramp up on top of (or more accurately, underneath) the largest storage region in the world – the Northeast U.S. This is a big topic with big implications. So rather than jumping into the middle of the upcoming gas storage transformation, we will walk through a multi-part North America natural gas storage blog series - its history and status, its challenges, who’s involved, and finally what could be in store going forward. Today we’ll start with some natural gas storage basics.
The Big Swinger
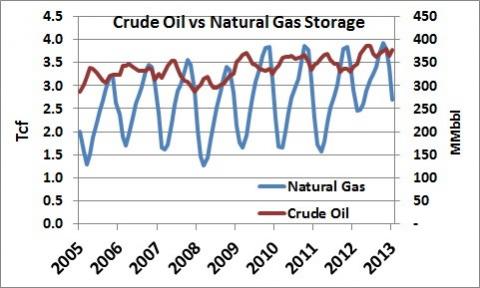
For starters, let’s get a sense of the huge swings that natural gas storage must accommodate. Consider the contrast between the storage usage pattern of natural gas versus that other high profile hydrocarbon, crude oil as demonstrated in Figure #1 below. The blue line shows U.S. natural gas storage balances (left axis) while the red line is U.S. crude oil storage balances exclusive of the Strategic Petroleum Reserve (right axis).
Figure #1 (click image to enlarge) Source: EIA
It is pretty obvious that natural gas storage swings widely according to season, while crude oil is quite stable by comparison. Granted motor gasoline and distillates have a little more seasonal swing, but nowhere close to natural gas. Just this fact tells you that storage is a very big factor in the workings of the natural gas market.
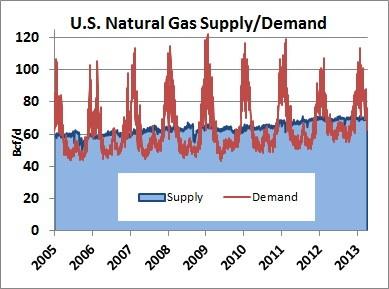
If that’s not enough to convince you, how about Figure #2? This is Bentek Cell Model Supply (production + imports) versus demand since 2005. Demand runs at lows of less than 50 Bcf/d during the summer months then skyrockets to more than 120 Bcf/d on cold winter days. Supply muddles along, moving up from 60 Bcf/d to 70 Bcf/d, due to production increases from the shale revolution, offset by declines in imports that are no longer needed. The only way the industry can meet winter demand peaks and have somewhere to put the summertime surpluses is storage. Storage is what makes the natural gas market work.
Figure #2 (Click Image to Enlarge) Source: Bentek
With that kind of swing, U.S. natural gas storage has to have some pretty incredible operating characteristics. In the next few paragraphs we’ll examine the basics of that storage infrastructure and how it developed in the ways that it did.
U.S. Natural Gas Storage Fundamentals
The U.S. has the capacity to store over 4,200 Bcf of natural gas in over 400 active storage facilities at any given time. Since 2000 there have been 108 expansions or new capacity projects built throughout the country. Almost all natural gas storage is underground in deep high pressure salt caverns, depleted oil or gas reservoirs, or aquifers. So, we can’t see it, but as described above it is critical to U.S. natural gas operations and its markets. It provides solutions to the inherent imbalances between continuous production and wide fluctuations in seasonal demand. It gives local distribution companies (LDCs) the ability to deliver gas supplies on the coldest winter day, while also maintaining a “safety net” for industrial and commercial customers. And of course natural gas storage can also fulfill the role of a trading center for natural gas marketers and speculators.
U.S. storage facilities are collectively owned by hundreds of entities, each with its own unique needs and motivations. For example, a number of LDCs serving markets in the Midwest and Northeast operate huge storage facilities near the markets they serve. Typically these are filled in the summer when long-haul pipeline capacity is readily available from the producing regions. Gas is withdrawn from storage in the winter when the pipelines run nearly full and can’t meet total demand. There is also production area storage which is used by natural gas marketers to store gas when prices are low and (hopefully) withdraw gas when prices are higher. Pipelines use storage as an operational necessity to balance receipts and deliveries. Various independent storage operators provide storage and all sorts of related services to many different industry participants.
One of the most basic functions of storage is “insurance” – protection against unexpected market events. A wide range developments can impact the delivery of natural gas, such as interruptions in production, pipeline mechanical problems, natural disasters and weather related demand spikes. In any such event, ample and properly located storage facilities can help avoid the ramifications of a supply interruption.
Location and Capacities
The U.S. has more natural gas storage facilities and more storage capacity than any other country. Canadians started the whole concept back in 1915 when natural gas was stored in a depleted gas reservoir in Weland County, Ontario. Not long afterward the first U.S. storage facility was developed just south of Buffalo, New York. By 1930, there were nine storage facilities in six different states.
Underground natural gas salt cavern storage followed LPG/NGL salt cavern storage by about a decade in both Canada and the US. (We reviewed the development of LPG/NGL storage in several blogs including Smoky and the Salt Caverns and Been Through the Desert to get Salt from the Brine.) The first natural gas salt cavern was established in Marysville, Michigan in 1961. It was originally called Brine Cavern Morton Number 16.
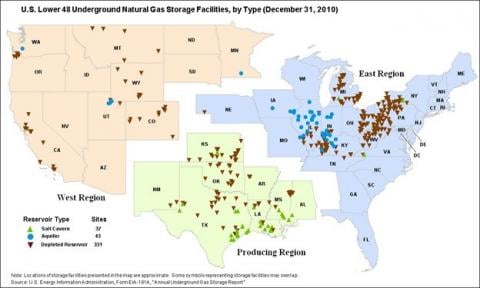
Today, at least 120 entities operate natural gas storage facilities across the U.S. Capacity has been growing at a pretty steady 3%/year, at least until recently. For purposes of statistical reporting, the U.S. Energy Information Administration (EIA) organizes the United States into three geographic areas: 1) the East Consuming region, 2) the Producing Region, and 3) the Consuming West as shown in Figure #3.
Figure #3 – Storage Facilities (Click Image to Enlarge) Source:EIA
Consuming East
The Consuming East is home to a majority of storage facilities with a combined working capacity of 2,298 Bcf. In fact, it is the largest regional network of natural gas storage facilities in the world. Historically the East has been incredibly dependent on storage withdrawals to meet demand because of very low temperatures in the northeastern U.S. during the winter months, the large population centers along the East Coast, lack of adequate long-haul pipeline infrastructure to meet demand on peak days, and the distance between the major demand areas and the major producing basins in the Gulf Coast and Midcontinent regions of the U.S. Most storage facilities in this region are depleted reservoirs in contrast to the high concentration of salt cavern storage facilities in the Producing Region. Average gas prices in the East have historically been higher than other parts of the United States because of population density, distance from traditional supply sources and lack of adequate long-haul pipeline transportation. It is in the Consuming East that the big changes in storage are coming as Marcellus and Utica production ramps up. But that’s a story for another blog.
Join Backstage Pass to Read Full Article


