The U.S. natural gas market in recent weeks has turned less bullish than when it began the injection season on April 1. Last week, natural gas production surpassed year-ago levels for the first time this year. Meanwhile, weather and related demand are lagging behind historical comparisons. The result has been larger injections into storage, a fast-rising inventory and lower prices. The CME/NYMEX Henry Hub futures price for the prompt July contract has been averaging about $3.029/MMBtu, down about 21 cents (6.4%) from where the June contract expired at $3.236/MMBtu. Today, we provide an update of the gas supply and demand balance and prospects for injection-season storage fill.
We last looked at potential supply-demand scenarios for the 2017 injection season in our blog You Keep Me Hangin’ On in early April. At the time, the market was just emerging from the second straight winter that wasn’t. The warm weather, particularly in January and February 2017, suppressed demand to well below normal. Remarkably though, despite the incredibly bearish effect of the weather on gas demand, the gas market balance (supply minus demand) ended the 2016-17 withdrawal season as a whole (from November 2016 through March 2017) an average of more than 3.0 Bcf/d tighter compared to the previous winter. Granted, demand still managed to average 0.6 Bcf/d higher winter-on-winter, given that the winter of 2015-16 was exceptionally balmy and exports of liquefied natural gas from Sabine Pass LNG provided 1.5 Bcf/d of incremental demand this winter. But the biggest driver of the balance was on the supply side — production this past winter lagged 2.5 Bcf/d behind the previous year as the rig count pullback took a toll on output. That meant that storage withdrawals were still strong enough to leave the U.S. inventory more than 400 Bcf lower year-on-year by the end of March 2017 — the official end of withdrawal season.
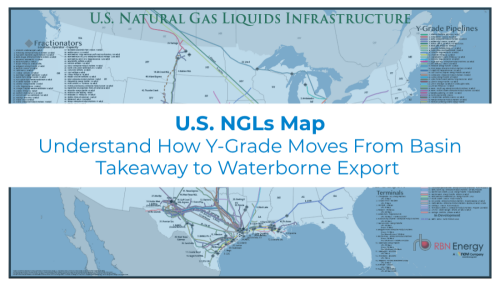
Visualize the infrastructure behind U.S. NGL movement.
The U.S. NGLs Map provides a comprehensive view of the transport, processing, and export networks moving NGLs across the U.S.
Had the past winter been more normal, the balance and resulting inventory would have been considerably more bullish. In other words, assuming normal weather, the injection season, which officially runs from April through October, inherited a relatively tight supply and demand balance with production well below year-ago levels. Starting with that season-ending inventory, we considered several potential scenarios for the 2017 injection season. Given the year-on-year deficit in the storage inventory and the underlying bullish supply/demand balance, and assuming relatively flat production, our analysis showed that it would take a substantial drop in weather-related demand and little to no incremental export demand to bring the inventory to record levels again this year (see the injection and inventory scenarios in You Keep Me Hangin’ On). Since then, however, weather-related demand has lagged, production has caught up to year-ago levels and injections have consistently exceeded expectations. So where does that leave us for the balance of the season? With two months of the injection season under our belt, it’s time to revisit the gas supply/demand balance.

About the song
"Can't Stand Losing You" is a song by English rock band The Police, released from their debut album Outlandos d'Amour, both in 1978. The song hit number 2 in the UK Singles Chart in 1979.