The Deepwater Horizon explosion in April 2010 effectively halted new drilling in the offshore Gulf of Mexico (GOM). Between April 2010 and June 2012 production fell by 400 Mb/d. At the same time the shale revolution led to increases in US production – up 790 Mb/d during 2012 – the largest annual increase on record. In the last quarter of 2012 GOM oil production began to recover and is forecast to increase to 1.5 MMb/d by the end of 2014. Today we look at the impact Macondo had on GOM crude production.
The April 20 2010 BP Macondo disaster had a momentous impact on the Gulf Coast regional crude oil production. The Federal government ordered a six-month moratorium on new deepwater drilling in US offshore waters (deepwater is considered to be greater than 500 feet deep). The moratorium also required existing permitted wells to stop drilling. The moratorium was lifted in October 2010 but it wasn’t until February 28, 2011 (314 days after Macondo) that the Interior Department approved the first new deep water drilling permit for an oil company.
As a result of the deep water drilling moratorium, crude oil production in the offshore Gulf of Mexico (GOM) region declined sharply during 2010 and 2011 (see chart below). Energy Information Administration (EIA) data shows that before Macondo in March 2010 GOM crude oil production was 1.6 MMb/d. Between April and December 2010 average production fell slightly to 1.5 MMb/d. During 2011 average production dropped to 1.3 MMb/d and continued to fall to a low of 1.1 MMb/d in June 2012. The latest EIA data indicates that production has begun to recover since then – increasing back to 1.4 MMb/d by November 2012. The increase was driven by the initiation of production at new deepwater fields with a combined expected peak production of about 195 Mb/d.
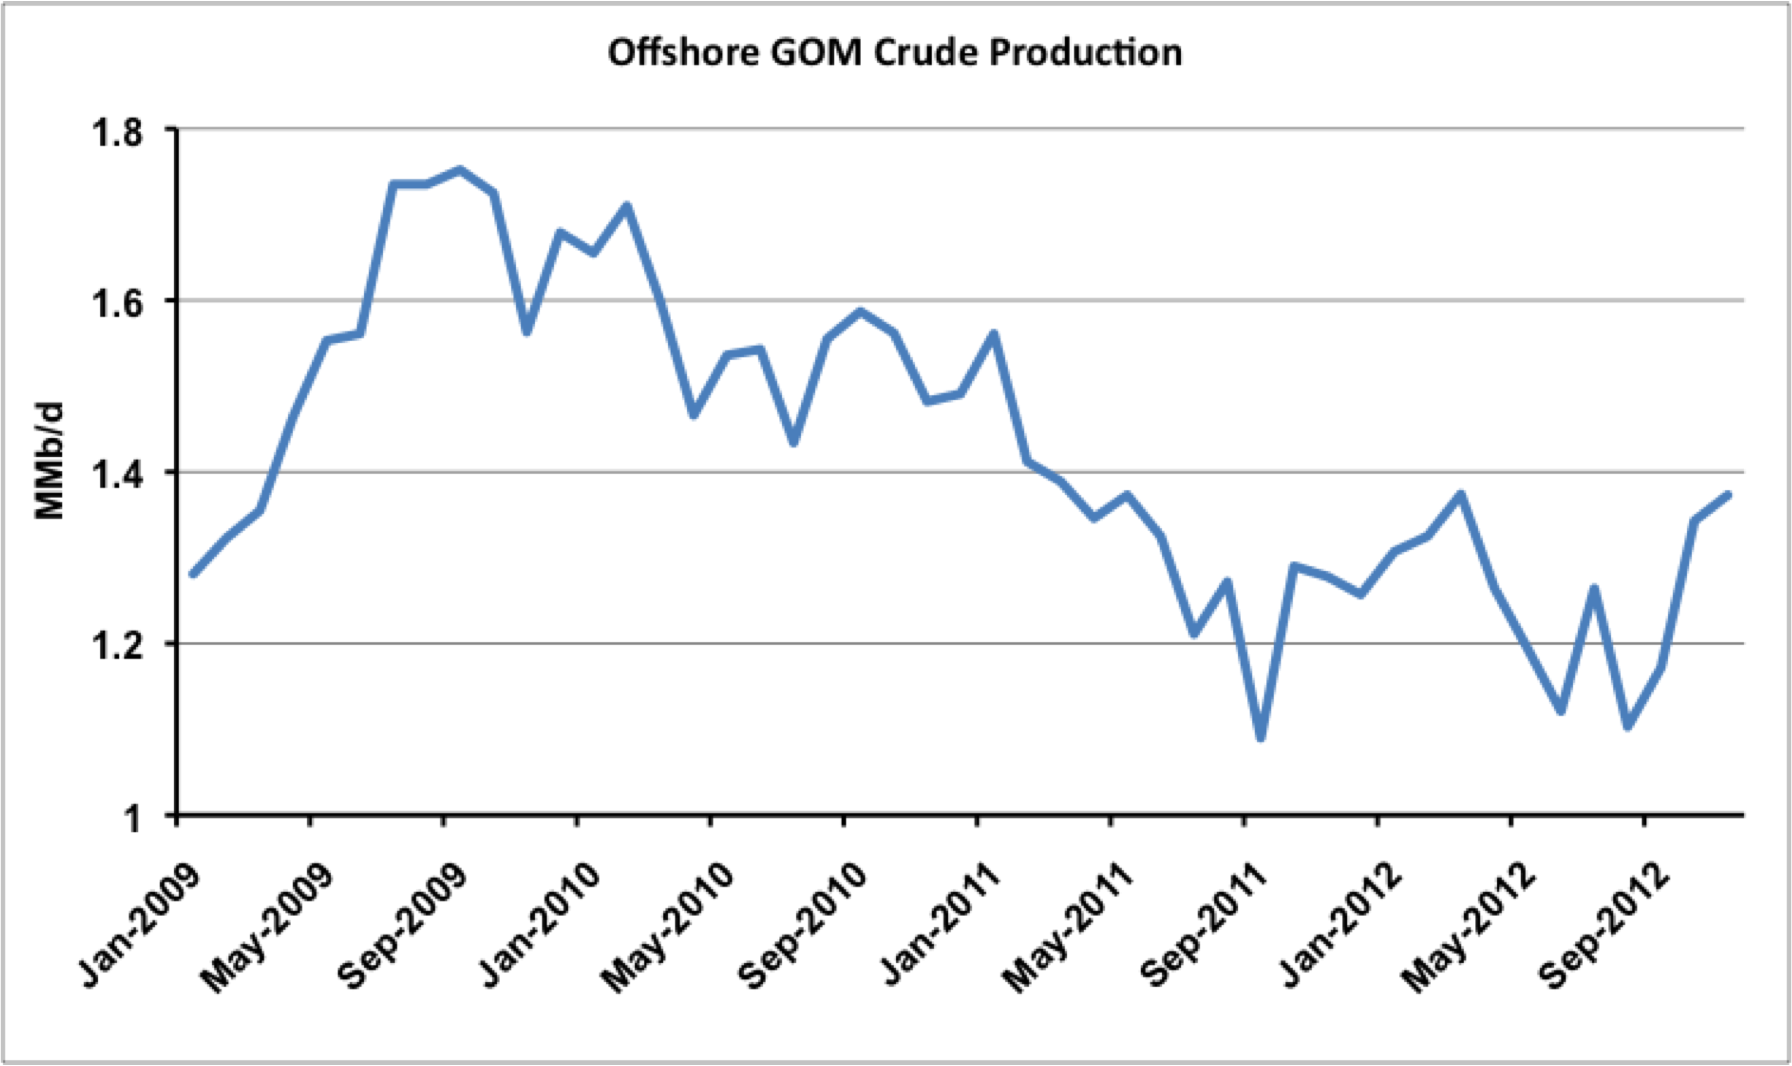
Source: EIA
The EIA short term energy outlook (STEO) published in April 2010 just before the Macondo accident indicated that after a decline in the first half of 2010 new GOM production expected online during the second half of that year would boost production above 1.8 MMb/d. That April 2010 forecast is the blue line on the chart below. In the same chart you can see that actual production (red line) was falling before Macondo and that instead of the STEO forecast uptick production continued to fall after Macondo. The chart also shows the latest February 2013 STEO forecast (purple line) that GOM crude production will continue its recovery in 2013 and 2014 to reach 1.5 MMb/d by the end of 2014. The expected increase in 2013 comes from 6 new field start‐ups and a redevelopment project. In 2014 several relatively high‐volume deepwater projects are expected on stream.
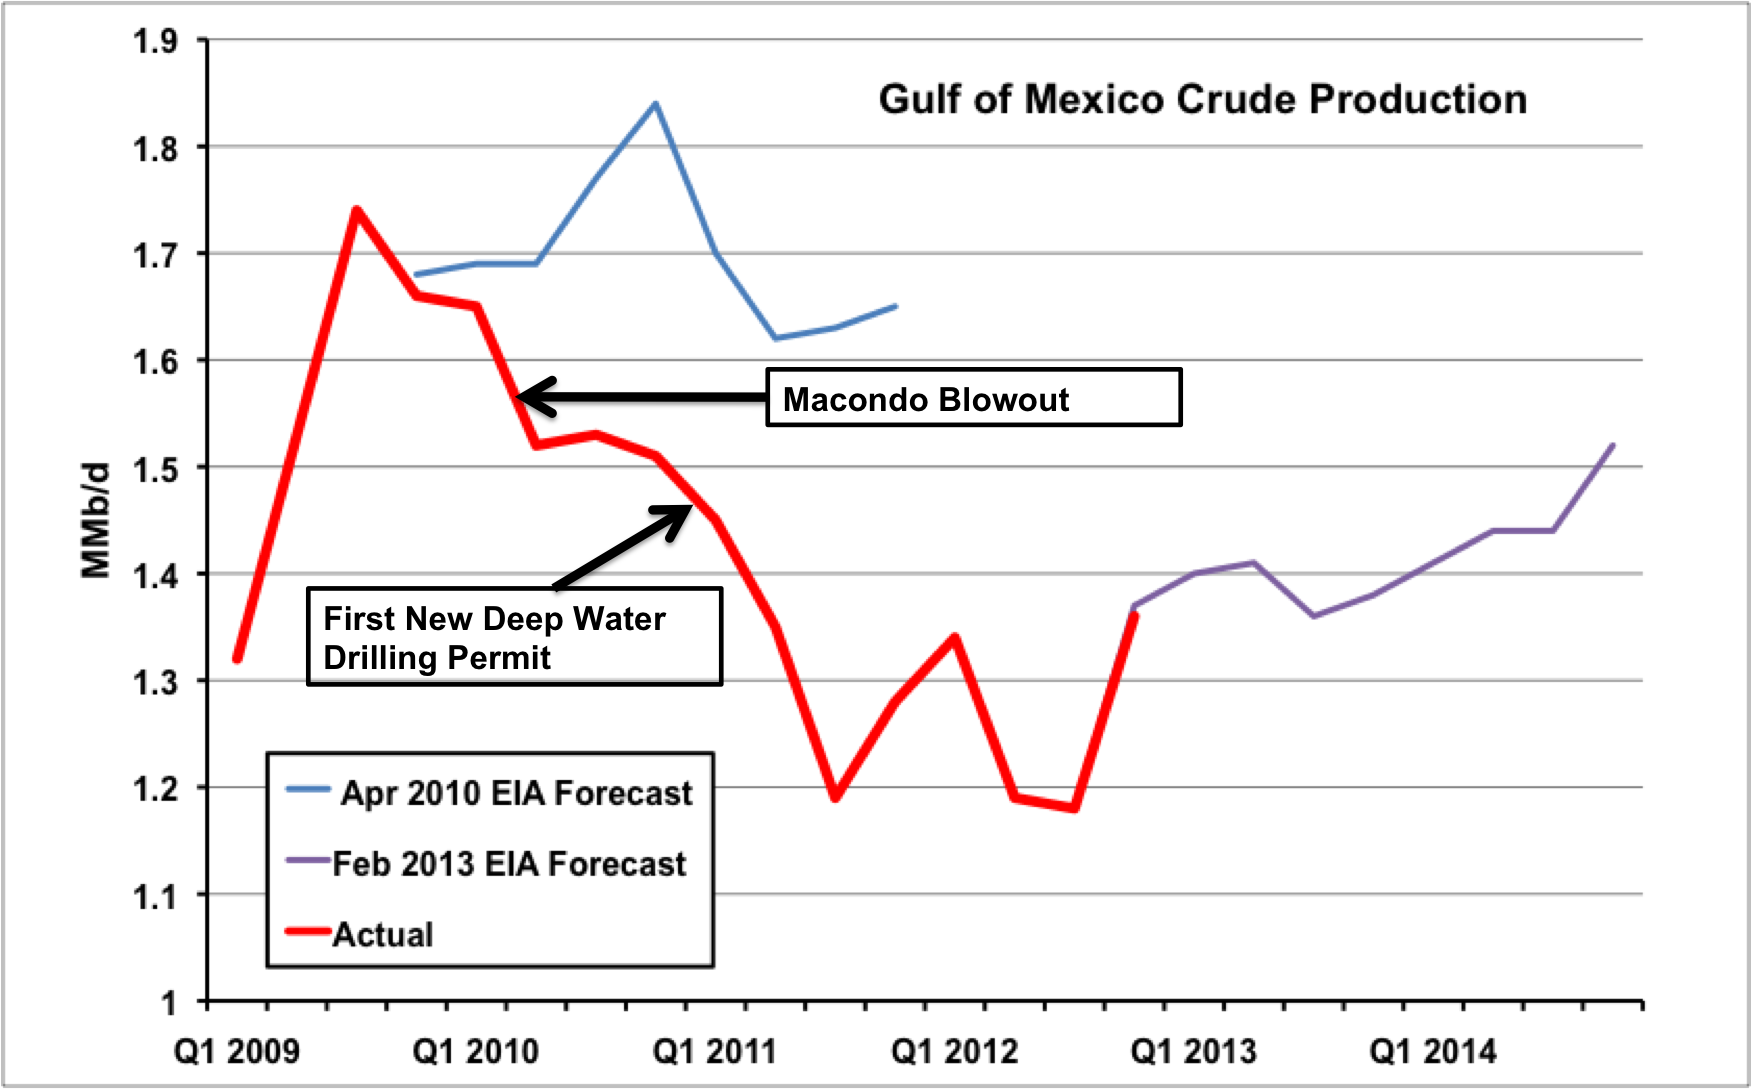
Source: EIA STOE and RBN Energy
The expected recovery in production over the next few years is confirmed by drilling rig count data from Baker Hughes in the next chart. The rig count fell off a cliff after Macondo (green circle) and stayed low during the moratorium but has now recovered to 53 rigs - just two below the level immediately before the accident.
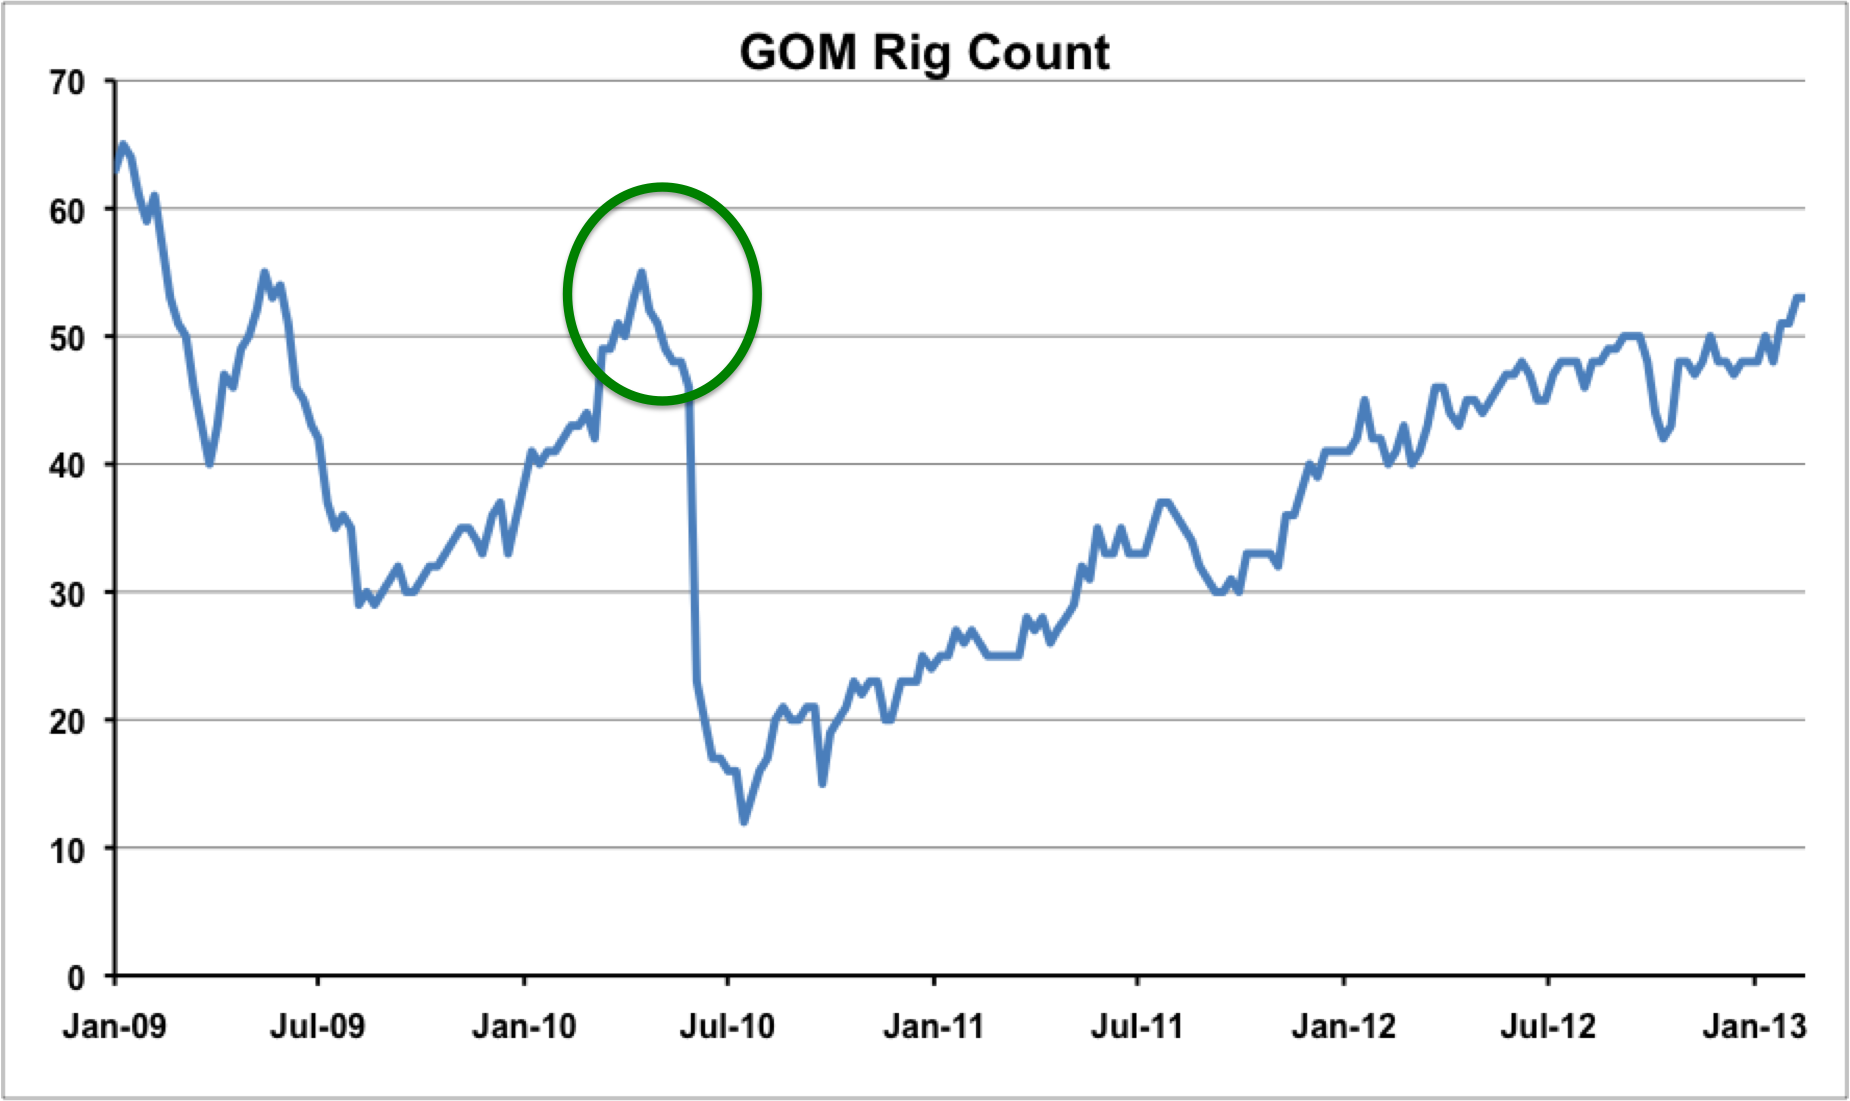
SOurce: Baker Hughes
We can also look at GOM production data for individual companies published by the Bureau of Ocean Energy Management (BOEM see the data here). The chart below shows the output in 2009 (before Macondo) and 2012 for the top 10 oil producers in the GOM. Before Macondo (blue columns) BP was by far the largest oil producer with more than double the output of its closest rival, Shell. Last year Shell was the biggest producer as a result of the drilling moratorium and BP not requesting new drilling permits until the end of 2011. Interestingly the profile of the top 10 GOM offshore producers did not change dramatically during this three-year period. At the same time onshore US crude production was revolutionized by tight oil shale production - led largely by independent producers. Significant differences in development costs and return on investment
horizons for deepwater drilling make the GOM a very different environment to the US shale plays.
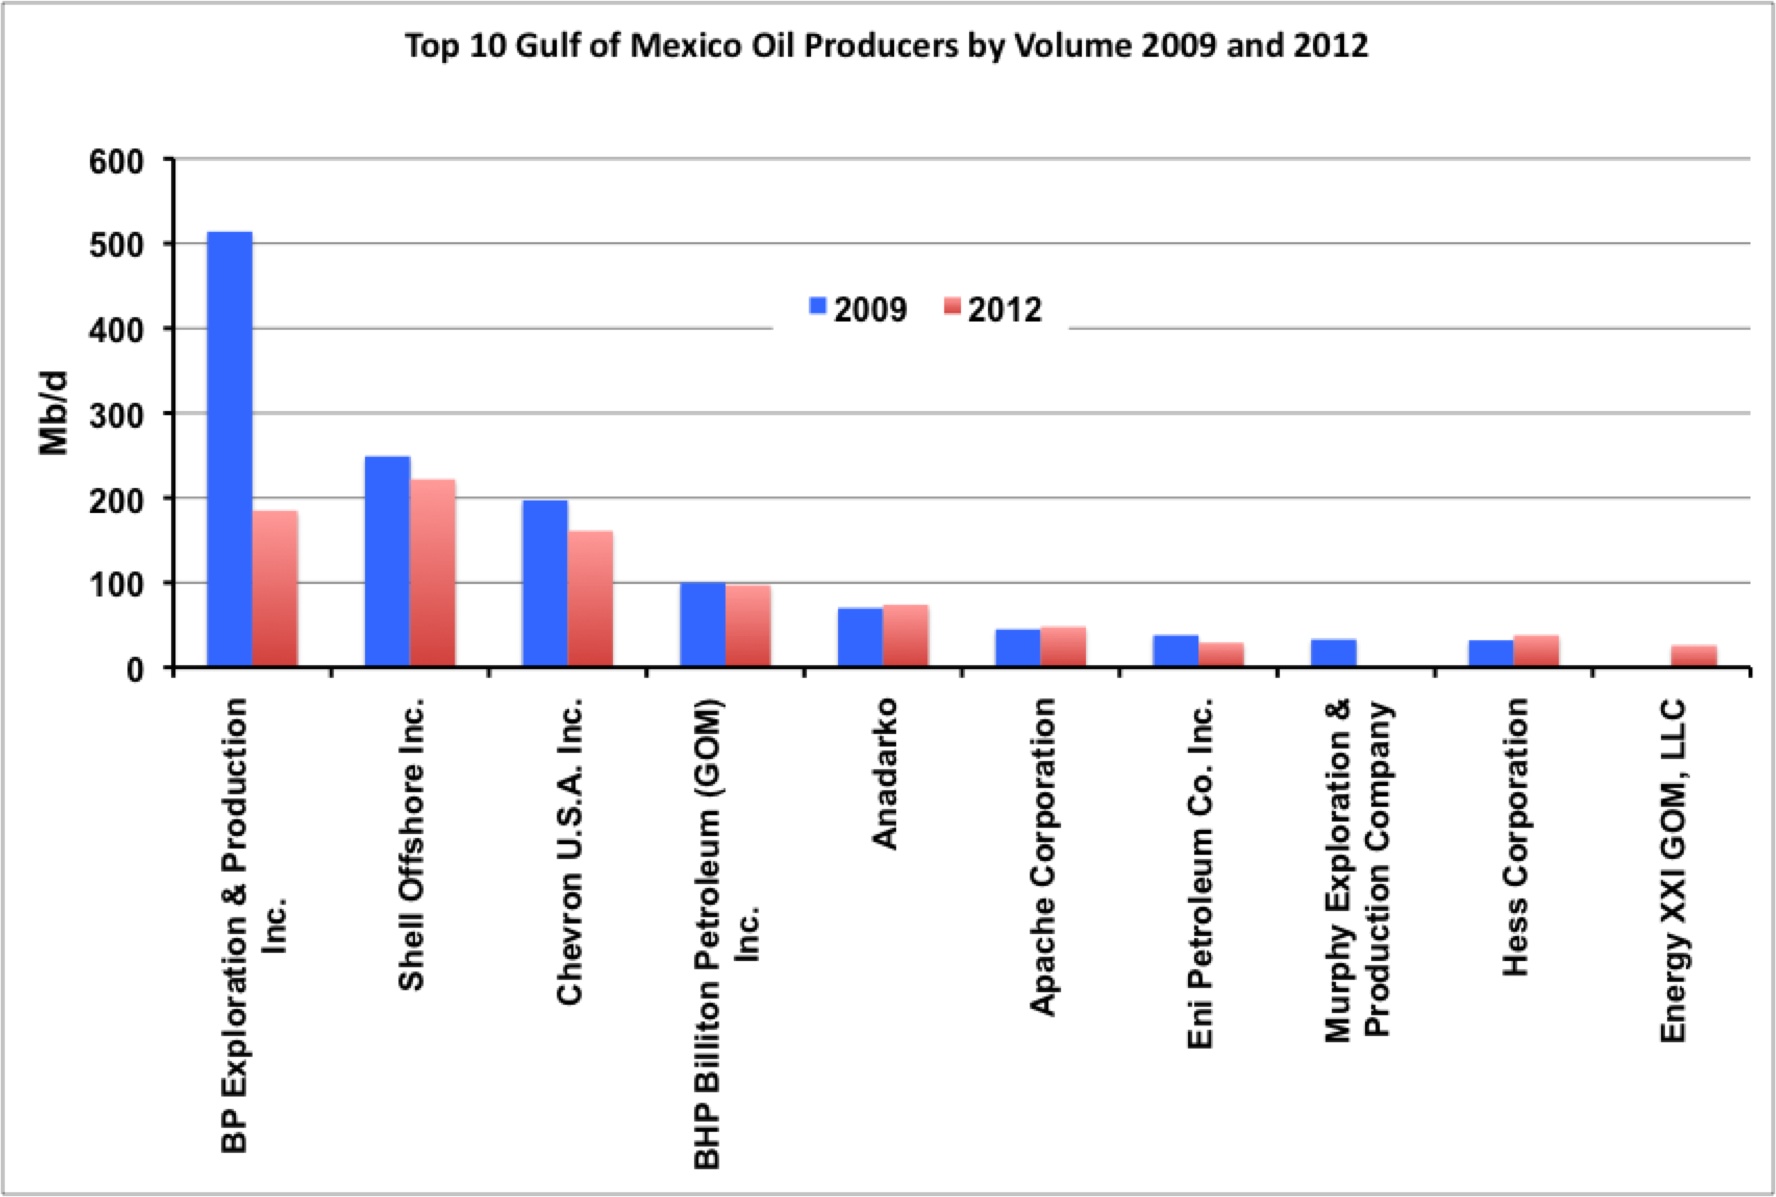
Source: EIA and RBN Energy
US crude oil production topped 6 MMb/d by the end of 2012 up by 790 Mb/d during the year - the largest increase in annual output on record. Most of that increase was in the Bakken, Eagle Ford and Permian basins. Prior to the shale revolution increases in US crude production between 2007 and 2010 came from offshore GOM fields. The Macondo accident in April 2010 halted GOM crude production growth and it is only just beginning to recover. The recovery proves that deepwater drilling risks are still considered worth taking by producers. GOM offshore production may not be headline news like shale oil but it still represents 20 percent of US production and that number looks set to increase in the next two years.
About the song
"Bridge Over Troubled Water" was written by Paul Simon, and appears as the first song on Simon & Garfunkel's fifth and final studio album of the same name. The song’s vocals were recorded in November 1969 at Columbia Studio B and E in New York City in November 1969, and the instrumentation was recorded the same month at CBS Columbia Square in Los Angeles. Paul Simon says the tune was written over a very short amount of time. Released as the second single from the album in January 1970, the song went to #1 on the Billboard Hot 100 Singles chart. It would become the biggest hit single for the duo of their career. The song won five Grammy Awards in 1971, including Record of the Year and Song of the Year. It has been covered by more than 50 artists, and has been certified Gold by the Recording Industry Association of America (RIAA). Personnel on the record were: Art Garfunkel (lead vocals), Paul Simon (backing vocals, acoustic guitar), Larry Knechtel (piano), Hal Blaine (drums), Joe Osborn (bass), Fred Carter Jr. (electric guitar), Gary Coleman (vibraphone), and Jimmie Haskell and Ernie Freeman (strings).
The album Bridge Over Troubled Water was produced by Paul Simon, Art Garfunkel, and Roy Halee. Released in January 1970, it went to #1 on the Billboard Top 200 Albums chart, and has been certified 8X Platinum by the RIAA. Four singles were released from the LP. A 72-minute documentary about the making of the album, The Harmony Game, was released in 2011.
Simon & Garfunkel are an American folk-rock duo formed in New York City in 1957, when they went under the name Tom & Jerry. They started using their real names when they signed a record deal with Columbia Records in 1963. The duo officially broke up in 1970, after releasing Bridge Over Troubled Water, the most successful record of their career. They have sold more than 100 million records worldwide and have released five studio albums, four live albums, one soundtrack album, 13 compilation albums, one EP, and 26 singles. Simon & Garfunkel have won one Brit Award, nine Grammy Awards, four Grammy Hall of Fame Awards, and a Grammy Lifetime Achievement Award. They were inducted into the Rock and Roll Hall of Fame in 1990. Both artists have gone on to successful solo paths since the duo's breakup, Garfunkel as a solo music artist and actor, and Simon as a music artist. They reunited for a tour in 2009, and a one-off concert at the New Orleans Jazz & Heritage Festival in 2010, but have not worked together since. Simon retired from performing in 2018.