May natural gas futures closed out last week at $2.089/MMbtu, down 5.2 cnts. The Henry Hub ICE cash day-ahead index was back below $2, coming in at $1.9802, down 8 cnts. Cash prices have now been hovering in the bottom-end of the $2 range for more than a month. U.S storage inventories are up to 2,479 Bcf, 60.5% over the five year average. Last year between the 2nd week of April and the beginning of storage withdrawals (during a hot summer with a lot of gas fired power generation), another 2,252 Bcf went into storage. If that happens this year, it would mean that the storage balance would top out at 4,631 Bcf – unfortunate since EIA tells us that capacity is about 4,200 Bcf. The implication is that storage inventories will max out capacity sometime in the early fall, basically hitting The Wall – with unknown consequences for natural gas markets. We don’t need no education. We need less gas or more demand.
This scenario has been talked about in the past, but something (i.e., weather) has always saved the day. How will it play out this time?
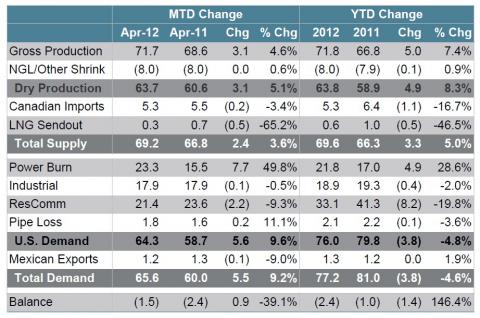
We examined this issue a few weeks back by looking at BENTEK supply/demand data in Half Full or Half Empty. Seems like a good time to refresh those numbers. Below is the natural gas supply demand summary table from BENTEK’s daily report issued last Friday, Apr. 6th. It is created using scheduled volumes at thousands of meter locations around the country that natural gas pipelines post on their websites. BENTEK aggregates this data in such a way to assess the overall supply/demand picture (and thus storage balances) on a daily basis. The table shown here is a subset of the BENTEK report that they provide periodically to a few companies that cover natural gas markets. Thanks again to BENTEK for including RBN on the distribution.
There are two sections of the table. On the left we have current month-to-date average volumes, comparing April 2012 with April 2011. On the right, Year-to-Date (YTD) volumes comparing 2012 with 2011.
On a YTD basis, dry production (gas that hits the pipeline after liquids have been stripped out) is up by 4.9 Bcf/d, or 8.3% over last year. The month of April is 5.1% over last year averaging 63.7 Bcf/d to date. Both are extremely healthy increases. But probably even more important is that when we looked at March 2012 a few weeks back, the number was 63.3 Bcf/d. That means that over the past few weeks natural gas production is not down, it is UP 0.4 Bcf/d! So much for those production cutbacks we heard about back in Feb.

Continuing to look at the YTD numbers, Canadian imports are down 16.7%, LNG sendout (volumes coming out of LNG terminals and hitting the pipelines) down 46.5%, but even with those declines total supply is still up 5%.
Total demand is down nearly as much as supply is up – lower by 4.6% YTD. As you might expect, most of the decline is from the residential/commercial sector, down by 8.2 Bcf/d or 19.8%. But Industrial demand is also off by 2%. Most likely this is not because of less industrial activity, but instead due to the mild winter and less gas required to heat industrial plants.
And that gets us to the real wild card for this summer, the power burn – or gas used for power generation. So far this year it is up 4.9 Bcf/d or 28.6%. Most of this increase is due to fuel switching – natural gas taking market share from coal. The big question for 2012 is whether or not there will be enough fuel switching to keep natural gas from hitting The Wall.
Last week a report from Credit Suisse through some cold water on that one (reported by Platts affiliate Gas Business Briefing). In short they said that if the power industry burns enough gas to solve the gas inventory problem, it will create a coal inventory problem. They estimate full inventory levels for coal at roughly 207 million short tons. In one of their scenarios, gas demand for power generation increases by 3 Bcf/d in 2012 versus 2011, and that would keep natural gas inventories from hitting The Wall. But coal demand would have to drop by 100 Million short tons, which would close coal inventories about 30 million short tons over capacity. Oops.
So it looks like something is going to hit The Wall. It all seems to boil down to the fact that it will be either gas producers shutting in (which has its own issues discussed here in You Can Pay Me Now, Or Pay Me Later – Does it Make Sense Shut-In Natural Gas?), or coal producers shutting in. What a strange world. The U.S. with too much energy. Which of course, makes me think of old rock song lyrics.

Each business day RBN Energy posts a Blog or Markets entry covering some aspect of energy market behavior. Receive the morning RBN Energy email by simply providing your email address – click here. |


Comments
Bentek's Daily Supply/Demand Balance Report
Sure hope that you got SHORTY Rusty!
If any of your readers would like a free trial to the Daily S/D report or more information about Bentek, please let me know.
bstephenson@bentekenergy.com