The monthly Energy Information Administration (EIA) Drilling Productivity Report (DPR) provides a leading indication of expected crude and natural gas production from seven leading shale basins across the U.S. The latest DPR released earlier this week (March 7, 2016) included a massive 2.5 Bcf/d upward revision to the shale gas production forecast for March. The upward revisions fly in the face of expectations of production declines at recent 17-year low prices. But they also validate daily pipeline flow data showing actual production climbing to a new daily record in February 2016 and continuing to stay robust. Today we break down the latest DPR data, what the revisions mean and consider implications for the market.
We’ve been following the DPR carefully since it was first published in 2013 (see Higher and Higher). Since then it has become an industry bellwether for shale basin production trends. The report takes lagged EIA production estimates, well production data from individual states as well as rig counts, and other data sources to produce a forecast for oil and gas production volumes from the seven major U.S. shale plays: Bakken, Eagle Ford, Haynesville, Marcellus, Niobrara, Permian and Utica. Unlike many other production forecasts, the DPR’s methodology is designed to capture the net impact of both the changing decline rates of existing wells (producing longer than 30 days) and the changing productivity of new wells . We provided a detailed explanation of the DPR’s model inputs, methodology, assumptions and risks in our blog series “Every Rig You Take.” The report’s bottom line is that if the monthly change in rig productivity in a shale basin is enough to offset monthly volume declines from older declining wells, then the DPR forecasts a rise in production and if the decline in volume from existing wells is the larger of the two, the DPR shows a decline in production.
The DPR’s rig productivity measure makes the report a more meaningful indicator of changes in the direction and rates of production than just using raw rig count data. But revisions are common in the world of production modeling and the DPR approach is no exception. Since the DPR relies on data inputs that are lagged or incomplete, revisions occur as more actual/final data becomes available. Additionally, the underlying calculations for rig productivity are based on recent historical trends, which may not accurately predict future productivity trends, especially given that the historical data is itself lagged or incomplete. Only as more actual/final production data becomes available does the extent of productivity changes become clear. The current low-price environment is particularly ripe for that kind of productivity improvement, as producers are relying heavily on higher efficiencies and lower costs to stay afloat.
Getting back to the current DPR data, this month’s natural gas revisions were particularly spectacular, not only for their sheer size but for the fact that they changed the direction of the trend. If previous DPR reports lulled you into thinking that shale production data is finally showing the steep declines expected in a low price environment, then the latest report certainly warrants a double-take. And based on conversations with the EIA, these weren’t the usual run-of-the-mill revisions. So let’s take a closer look at the data, starting with DPR’s estimates of total U.S. shale gas production.
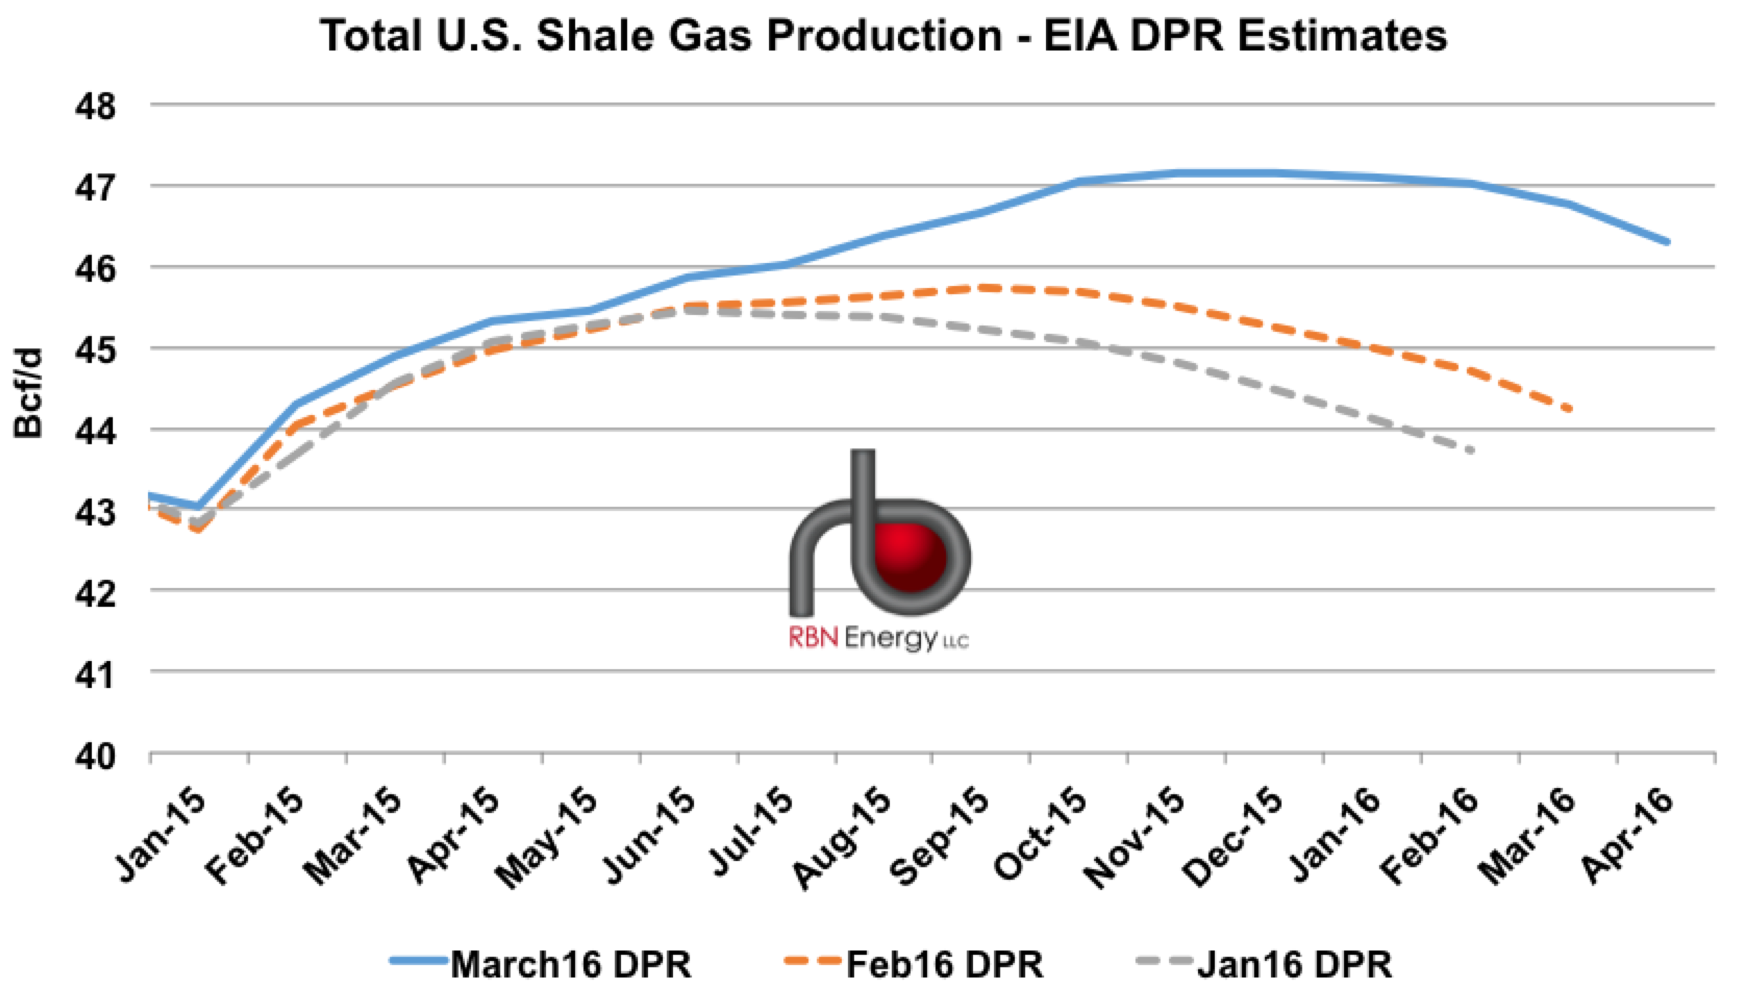
Figure 1; Source: EIA Drilling Productivity Report, RBN Energy
About the song
“We Can Work It Out” was written by Paul McCartney and John Lennon. It appeared as a double A-side single backed with “Day Tripper” that was released in December 1965. It went to #1 on the Billboard Hot 100 Singles chart and has been certified Gold by the Recording Industry Association of America. The song was recorded in two takes at EMI studios in London during the sessions for the Rubber Soul album. It was earmarked to be the non-album double A-side single to be released at the same time as the LP. A promotional film of the song with The Beatles was shot at Twickenham Film Studios in London with Joe McGrath directing. Personnel on the record were: Paul McCartney (lead vocal, acoustic guitar), John Lennon (Mamborg harmonium, bass, backing vocals), George Harrison (acoustic guitar, backing vocals), and Ringo Star (drums, percussion).
Rubber Soul was the album The Beatles were working on during the recording of “We Can Work It Out” and “Day Tripper.” Recorded between October-November 1965 at EMI studios in London with George Martin producing, it was The Beatles’ sixth studio album. Released in December 1965, it went to #1 on the Billboard 200 Albums chart and has been certified 6x Platinum by the RIAA.
The Beatles were an English rock band formed in Liverpool in 1960. Consisting of John Lennon, Paul McCartney, George Harrison, and Ringo Starr, they are regarded as the most influential band of all time. They released 17 studio albums, five live albums, 51 compilation albums, 36 EPs, and 63 singles. They have sold over 600 million records worldwide, making them the best-selling music act of all time. They are members of the Order of the British Empire (MBE), the Rock and Roll Hall of Fame, UK Music Hall of Fame, Vocal Group Hall of Fame, and have won one Academy Award, seven Grammy Awards, a Grammy Lifetime Achievement Award, 15 Ivor Novello Awards, one MTV Video Music Award, and three World Music Awards. Paul McCartney was knighted by Queen Elizabeth II in 1997. After the group’s breakup in 1970, all four band members went on to successful solo careers. John Lennon was murdered in December 1980. George Harrison died in November 2001. McCartney and Starr continue to record and tour as solo artists. There is rumor of a new Beatles track being released: a 1978 John Lennon composition called “Now and Then” being recreated by Paul McCartney using artificial intelligence to include all four of The Beatles on it. It is unknown if George Harrison’s “Sue Me, Sue You Blues” will be the flip side.