As the clock approached midnight on December 31, E&P managements and shareholders likely clinked champagne flutes to celebrate a remarkable four years of prosperity for an industry that had been nearly shattered by two decades of periodic financial crisis. Soaring post-pandemic commodity prices and gold-plated balance sheets provided generous cash flows, enabling substantial shareholder payouts that restored investor support, but after a period of relative stability the outlook for the E&Ps we follow is uncertain. In today’s RBN blog, we’ll review the cash-allocation strategies used by U.S. oil and gas producers in 2024 and examine the factors that could dramatically impact the sector’s performance in 2025.
Let’s take a brief look at recent history. WTI oil prices cratered to under $20/bbl in early 2020 and averaged just $39.16/bbl for the year. That nearly doubled to $68/bbl in 2021 and rose another 50% to $95/bbl in 2023. Cash flow from operations (CFOA or cash flow) for the publicly traded E&Ps we cover rose from $36 billion in 2020 to $76 billion in 2021 and a record $127 billion in 2022. That allowed producers to institute unprecedented dividends and share buybacks, which rose from a combined $15 billion in 2021 to $45 billion in 2022. The average oil price retreated to $77.58/bbl in 2023 but cash flows of $101 billion supported a still historically strong $31 billion in share buybacks and dividends. The average dividend yield for the E&P sector in 2023 was 3.8%, just above the 3.7% paid by the utility sector, which was second highest, and nearly three times the average 1.3% yield for the S&P 500.
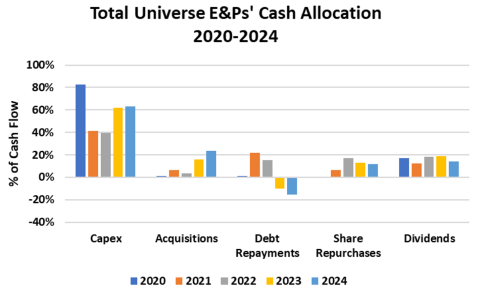
The average WTI oil price remained steady at $76.55/bbl in 2024. But the 37 E&Ps in our universe generated $105 billion in cash flow in 2024, 3% higher than in 2023, mainly due to acquisitions completed during the year. Total investment (including non-upstream capex) was $66.4 billion, 5% higher than 2023. This yielded a re-investment rate of 63% of CFOA in 2024 (blue bar in Capex grouping in Figure 1 below), just ahead of the 62% plowed back in 2023 (yellow bar). These two most recent years stand in stark contrast to 2021-22, when the reinvestment rate fell to circa 40% (orange and gray bars), and 2020, when 82% of CFOA (blue bar) was put back into oil and gas assets.
Figure 1. E&P Cash Allocation, 2020-24. Source: Oil & Gas Financial Analytics, LLC
Join Backstage Pass to Read Full Article


