We just finished up the hottest July on record. Very high temperatures cause air conditioning demand to go ballistic. System operators struggle to generate enough power to satisfy peak load and call on expensive “peaker” generation units that set a high market price for power. With gas prices trading lower these days, the spread between high power prices and the cost of the gas fuel to generate that electricity (the spark spread) widens considerably during a heat wave. Today we look at spark spreads during July in New York City.
A few weeks back in “Talkin ‘Bout My Generation Part II”, we calculated heat rates and the cost of fuel to generate electricity. In that case we were trying to understand the relative fuel costs for coal and gas that would signal power system operators to dispatch combined cycle gas turbine (CCGT) generation instead of coal steam plants based on the lowest operating cost. Natural gas has been winning that fuel cost contest this summer (see “Power Burn Sensation”). The spark spread is a similar calculation that measures the difference between the market price obtained for power and the cost of the fuel to generate power. The spark spread indicates a power generator’s marginal return from selling power. Analysts use spark spreads to calculate the marginal return on natural gas generation plants. For reasons best known to themselves, analysts use another name – dark spreads- for the same calculation performed for coal plants. We are going to stick to natural gas and spark spreads here.
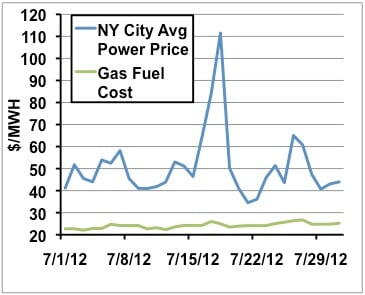
The best way to understand a spark spread is to see one in action. The chart below shows the two components of the spark spread. The first is the cost of natural gas fuel (green line) and the second the power price (blue line) for New York City during the month of July 2012.
Source: New York ISO Data from Morningstar, ICE Data from www.theice.com
The cost of natural gas fuel uses the same heat rate calculation of a typical CCGT gas generation plant that we used in the “Talkin ‘Bout My Generation” blogs. It boils down to plant efficiency and the heat rate – in this case a typical CCGT plant burns 7619 btu/kwh meaning the cost of the gas is 7.619 X the natural gas price. The natural gas price used is the ICE Day Ahead Index for the Transco Zone 6 New York price point – the closest market price to New York City.
To estimate New York City power prices we used data from the New York Independent System Operator (NYISO). The NYISO calculates a “day ahead” price for every hour during the following day. The day ahead hourly price is calculated based on anticipated utility requirements and generation availability as well as load forecasts. NYISO calculates for thousands of individual pricing points wherever power enters or leaves the transmission grid. In this case the price we are using is a system calculated zonal average for all the price points in New York City (Zone J). The day ahead price calculation sets hourly prices for the next day – when power will flow. To make things easier we calculated an average of each hour during the day leaving us with just one price for the day. NYISO price levels are set by the highest cost generation capacity required to meet anticipated demand during the hour. If demand is high then price levels can spike to match the cost of expensive (e.g. oil fired) peaker generating units. You can see on the chart that this situation arose on July 18, 2012 when the daily average price jumped to over $110/MWH.
Next we take the two components and calculate the difference between power prices and the gas fuel cost to arrive at the spark spread. The chart below shows the result.