There’s never been any reason to question the drivers for energy infrastructure development — until now. Historically, the drivers were almost always “supply-push.” The Shale Revolution brought on increasing production volumes that needed to be moved to market, and midstreamers — backed by producer commitments — responded with the infrastructure to make it happen. But now things seem to be different. U.S. energy infrastructure investment is soaring across crude oil, natural gas and NGL markets and, as in previous buildouts, midstreamers are bringing on new processing plants, pipelines, fractionators, storage facilities, export terminals and everything in between. We count nearly 70 projects in the works. But crude production has been flat as a pancake, natural gas is down, and lately NGLs are up — but as you might expect, only in one basin: the Permian. So what is driving all the infrastructure development this time around? In today’s RBN blog, we’ll explore why that question will be front-and-center at our upcoming School of Energy: Catch a Wave. Fair warning, this blog includes an unabashed advertorial for our 2024 conference coming up on June 26-27 in Houston.
In observance of Juneteenth, we are giving our analysts a break and replaying a recently published blog on oil, gas and NGL markets. If you didn’t read it then, this is your opportunity to see what you missed!
Anemic Production Trends
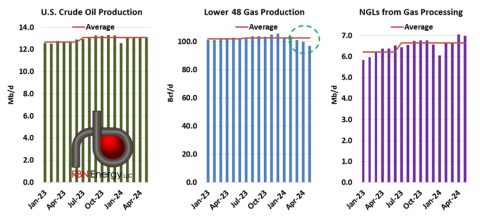
Let’s start with the first part of our basic premise — production of what we refer to as the three drillbit hydrocarbons has been mostly flat. As shown in the left graph in Figure 1 below, U.S. crude oil production today stands at 13.1 MMb/d. In fact, it's averaged 13.1 MMb/d for the past 10 months. Lower 48 natural gas production (middle graph) inched higher last year, up to an all-time record of 105 Bcf/d in December, but has steadily declined this year to about 96 Bcf/d (dashed green circle), back to where it was two years ago, in May 2022. The one bright spot is NGLs (right graph), up about 7% from the first half of 2023 to an average of 6.7 MMb/d over the past 12 months.
Figure 1. Crude Oil, Natural Gas and NGL Production. Sources: EIA, RBN
Join Backstage Pass to Read Full Article


