


It’s well understood today that the U.S. natural gas market turned from potential domestic shortages to major LNG exports thanks to the Shale Revolution. What is not so well remembered is that the dramatic shift in the U.S. gas market wasn’t widely understood at the time and took several years to be accepted by the energy industry. In today’s RBN blog, we turn our attention to the beginnings of the Shale Revolution and how it allowed the U.S. to evolve into the world’s largest LNG exporter.
Analyst Insights are unique perspectives provided by RBN analysts about energy markets developments. The Insights may cover a wide range of information, such as industry trends, fundamentals, competitive landscape, or other market rumblings. These Insights are designed to be bite-size but punchy analysis so that readers can stay abreast of the most important market changes.
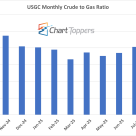
The monthly NYMEX crude-to-gas ratio for September 2025 stands at 21.4, where crude was $63.81/bbl and gas was $2.98/MMbtu, a slight decline from August’s 22.1.
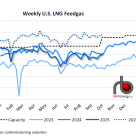
U.S. LNG feedgas demand averaged 15.4 Bcf/d last week (see blue-dotted line in figure below), up 0.1 Bcf/d from the previous week despite lower intake at Cove Point.
Next Year’s Super Bowl (February 3, 2013) will provide the usual mix of brawn and hokey consumer advertising. RBN is betting that the WTI discount to Brent will fall well below its current $22.76 /Bbl before then. Early next year new pipeline pathways out of the Midwest and West Texas to the Gulf Coast and growing railcar traffic out of the Bakken will put an end to the Cushing Supply glut. Important signals today suggest the WTI discount should narrow sooner, but prices for the two crudes remained stubbornly far apart last week. Today we explain why the spread hasn’t narrowed already and the fundamental pressures that will overwhelm it come the spring.
The new domestic energy rush has supplied North America with a potent new cocktail of hydrocarbons. Not only are we producing more oil and gas here than we have in decades, but we are producing more of certain kinds of hydrocarbons than North America’s existing energy infrastructure is built to handle.
We’re talking about the “C” word: Condensates. Today we introduce a blog series on condensates.
As RBN Energy explained last February (see “neither fish nor fowl”), condensates are a highly volatile hydrocarbon mixture that is classified somewhere between crude oil and natural gas liquids. Condensates are showing up in abundance both in new “wet gas” plays, where they drop down as liquids from gas streams during the field production process, and in oil shale plays, where condensate is part of the liquid coming straight out of a wellhead.
The gestation period from concept to in-service for a new natural gas pipeline can take at least 3-4 years. A significant number of these projects are underway today in the Northeast US in response to dramatic increases in local production. Today we continue our series on changes in the Northeast with a look at the process required to develop pipeline infrastructure.
In our previous posting we talked about the dramatic changes in strategies, infrastructure and operations in the Northeast resulting from the successful development and growth of Marcellus natural gas production. Some of these investments by pipelines, and shipper commitments for transportation agreements, are quite sizable and can cause a high degree of angst. One of the factors that makes this so difficult for everyone is that the timeline for an interstate pipeline to place new capacity into service can typically take three to four years from conception to in-service. That’s a long time in a dynamic industry and as we have seen, significant changes can take place in that long a period. Before we drill down to the strategic and 'operational aspects, it would be helpful to understand why it takes so long and what is involved in the development process to bring new pipeline capacity on stream.
NGL production in the Marcellus is growing by leaps and bounds. There is only one play projected to grow faster – Utica. And Utica sits just a few thousand feet below the Marcellus. Combined NGL production from the two plays is projected to range between 450 – 600 Mb/d depending on who’s forecast you like best. But as fast as these volumes are coming on, natural gas processing capacity and fractionation capacity are being expanded even faster. Are the midstreamers getting ahead of the producers with 22 gas plant projects and 11 new fractionators or expansions in the works? Or do these midstreamers know something that is not baked into the various industry production forecasts? Let’s see what the most recent projections are telling us.
Most Americans only come into contact with the Jones Act when they wonder why their cruise ship stopped off at a foreign port. This maritime legislation from a bygone era (1920) is nearly a century old. The Jones Act increases costs for US coastal shipping. That constraint has restricted the availability of waterborne options to alleviate recent US energy supply bottlenecks. Today we look at the impact of the legislation in energy markets.
The US American Phoenix, a 339 MBbl oil tanker built in Mobile, AL was launched earlier this year on June 21, 2012 (see picture below). The American Phoenix is the only US built tanker to be launched so far in 2012. On her maiden voyage in August the American Phoenix delivered a cargo of gasoline from Lake Charles, LA to Port Canaveral FL, two United States ports.
News flash! ---Rail transportation has become a very big deal in the business of transporting crude oil, NGLs and petroleum products!!----The whole world does not revolve around pipelines! Yup, the media has discovered that hydrocarbons can ride the rails. Never mind that liquid hydrocarbons have been moving in tank cars for 150 years. The news is that rail is having a market impact like never before. And that is because there has been a strategic shift in the way rail transportation is being used by the petroleum industry. In Part II of our series we’ll dissect the strategies being used and discuss how things are evolving in the world of tank cars.

Over the next five years, production of natural gas liquids (NGL’s) from gas processing plants will increase by at least one million barrels per day, or about 40% over 2012. Perhaps more. That’s good news for natural gas producers, processors and end-use markets. But there is a catch. The rate of production does not match up with demand. While production is a steady, “ratable” volume, demand is anything but ratable. Demand swings with petchem feedstock economics, the gasoline blending season, weather and a myriad of other factors. The flywheel that balances supply and demand on any given day is storage. But not just any storage. For NGLs, storage of large volumes means salt caverns. Huge caverns thousands of feet below the surface. In this NGL storage blog series starting today, we’ll look at the history of NGL salt storage, where it exists, how it is used, and where more of it is needed. In this first installment we’ll go all the way back to the origin of NGL salt storage. All the way back to Smoky Billue.
The NYMEX New York October gasoline contract expired last Friday at $3.34/Gal, up 13 percent during the week from $2.91/Gal last Monday (September 24, 2012). In contrast the November contract closed 42 cents lower than October on Friday at $2.92/Gal. The sudden jump in October New York gasoline prices during the last week of trading was caused by severe supply problems in the Northeast US. This week new cargoes en-route to New York have calmed market fears but the disruptions look set to repeat in a tightly balanced market. Today we investigate what happened.
Permian crude production is experiencing a renaissance. This month (September 2012) Bentek estimated current production at 1.3 MMb/d. Most of that production not absorbed by local refineries is shipped to Cushing or further into the Midwest where prices are depressed versus the Gulf Coast. New takeaway capacity projects look to change that balance towards the Gulf Coast over the next two years. Today we explore how West Texas crude prices will be impacted by access to the Gulf Coast.
Next time you fill up with regular; spare a thought for what the product went through to make it into your tank. Before you got a chance to put the pedal to the metal, the tiger in your tank had to treat a digestive problem that was causing too much gas. It was all in honor of something called Reid Vapor Pressure (RVP) regulations. Today we open the window on the issue to air the pungent details.
|
Check out Kyle Cooper’s weekly view of natural gas markets at |
RVP stands for "Reid Vapor Pressure" a measure of gasoline volatility indicated in pounds per square inch (PSI) at 100 degrees Fahrenheit. The higher a gasoline's RVP the more quickly it evaporates. The RVP for gasoline should always be below normal atmospheric pressure or 14.7 PSI. If the RVP gets higher than 14.7-PSI fuel might evaporate in the gas tank on a hot day resulting in a vapor locked engine (car won’t start) or worse yet, an explosion. At the same time you need a certain RVP level in the winter when it gets cold or your car won’t start because the fuel won’t vaporize in the carburetor.
The 51-mile long Panama Canal completed in 1914 connects the Caribbean Sea to the Pacific Ocean. By passing through the Canal ships reduce voyage distances by thousands of miles and journey times by 10 days or more. The Canal is currently constrained by the dimensions of its lock system that limit the size of vessel that can pass through. An expansion project started in 2006 and set to complete in early 2015 will increase the dimensions so that larger ships can use the canal. Today we assess the consequences for tanker movements.
Henry Hub is the center of the natural gas spot-trading universe with virtually every btu being sold at a price linked in some way to this market center. Henry Hub is also the delivery point for the CME/NYMEX natural gas commodity futures contract that is now the third largest in the world. In the past 5 years the shale gas phenomena has revolutionized North American gas supplies and changed the shape of the traditional south to north producer to consumer delivery pattern. More changes are on the way. Today we continue our blog series by asking whether Henry Hub still holds its own as the CME delivery point.
Apart from local refinery demand, the majority of Permian Basin crude production is currently shipped to Midwest refiners on existing pipelines. New takeaway capacity projects look to change that balance towards the Gulf Coast where prices are higher now. Today we review projects to add almost 1 million barrels per day of new Permian takeaway capacity by the end of 2014.
US nitrogen based fertilizer prices are currently at record levels as a result of high demand from farmers. Farm demand for fertilizers is driven by crop prices. The Midwest drought this year has pushed corn prices through the roof, creating strong demand for fertilizer to improve crop yields. Nitrogen fertilizers are derived from ammonia – largely produced using natural gas. The current cost to produce ammonia from natural gas is about $98/ton. With farmers in Iowa paying over $800/ton for fertilizer this month producer margins are extremely attractive. One company is pushing a new “mobile” technology to make fertilizer from surplus natural gas in the Bakken. Today we look at fertilizer market fundamentals.

The Henry Hub is the best known natural gas trading location in the world. There is certainly no more liquid point in the industry. An average of almost 400,000 natural gas futures contracts trade there each day. The Henry price is used to compute location ‘basis’ at all other natural gas trading points in North America and thus is the reference price for tens-of-thousands of derivative instruments and other commercial contracts. In effect, the Henry Hub is the center of the natural gas trading universe. What if I were to tell you that Henry Hub is not a hub? It is not all located at some single spot you can drive by called Henry. And the gas flow through this so called hub is minimal. Could this be another LIBOR scandal where a benchmark is not what we thought? Or is all well and good at Henry, regardless of these revelations? Let’s find out why Henry is the Hub, why it developed the way it did, and how changes in gas flows from the big shale plays could impact Henry in the future.