


More than 70 new data centers are under development in Virginia, which is already the world’s leading hub for the massive, high-tech facilities. But given the rapid pace of the buildout and the challenges that come with it, it’s probably no surprise that not everyone in the Old Dominion State is as enthusiastic about data centers as they once were. In today’s RBN blog, we’ll look at some of the biggest data centers in the works and discuss their path forward.
Analyst Insights are unique perspectives provided by RBN analysts about energy markets developments. The Insights may cover a wide range of information, such as industry trends, fundamentals, competitive landscape, or other market rumblings. These Insights are designed to be bite-size but punchy analysis so that readers can stay abreast of the most important market changes.
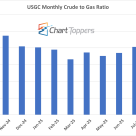
The monthly NYMEX crude-to-gas ratio for September 2025 stands at 21.4, where crude was $63.81/bbl and gas was $2.98/MMbtu, a slight decline from August’s 22.1.
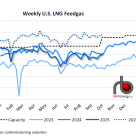
U.S. LNG feedgas demand averaged 15.4 Bcf/d last week (see blue-dotted line in figure below), up 0.1 Bcf/d from the previous week despite lower intake at Cove Point.

The economics for U.S. LNG entered new territory this year, as price spreads to international destinations, particularly from the Gulf Coast export terminals, went from an average $4-8/MMBtu a couple of years ago to $1/MMBtu or less in 2020 to date. The tighter spreads reduced netbacks for U.S. offtakers and led to mass cargo cancellations this summer. Moreover, current futures curves show Henry Hub price spreads to Europe and Asia staying mostly in the $1-$3/MMBtu range over the next few years, suggesting that the arbitrage for U.S. LNG exports, particularly from the Gulf Coast terminals, likely will remain tighter and make commercial decisions to lift or cancel U.S. cargoes much more nuanced than they ever were before. Today, we delve into the primary cost components that factor into offtakers’ netbacks.

The offshore Gulf of Mexico is often viewed as the rock-steady player in U.S. crude oil production. Unlike price-trigger-happy shale producers that quickly ratchet their activity up or down, depending on what WTI is selling for that month or quarter, producers in the Gulf base their big, upfront investments in new platforms or subsea tiebacks on very long-term oil-price expectations. Also, unlike shale wells, whose production peaks early then trails off, wells in the GOM typically maintain high levels of production for years and years. But don’t think for a minute that production in the Gulf can’t spike down, if there’s a good reason. GOM output dropped by 300 Mb/d, or 16%, from March to April as producers shut down wells in response to sharply lower oil prices, and a couple of weeks ago more than 80% of GOM wells were taken offline in anticipation of Hurricane Laura. Today, we look at offshore oil production ups and downs in a wild and woolly year and what’s ahead for the GOM.

Over each of the past eight years, we’ve opened the doors at RBN’s School of Energy with updated analytical models, new subject modules, and timely special features that have reflected the evolution of energy markets from the early days of the Shale Revolution and $100/bbl crude oil, through the price crash of 2015-16 and the incredible 2017-19 rebound. But these market shifts pale in comparison with what’s happened so far in 2020: a global pandemic, crude crashing to negative $37/bbl, a wipeout in LNG exports, a Cat 4 hurricane into Lake Charles — it just seems to keep on coming. Which means there has never been a more important time to reassess market analytics in the context of these tectonic shifts in the energy industry. That is exactly what we’ll cover today in this blatant advertorial for RBN's Fall 2020 School of Energy.

As the year 2020 wears on, it seems that every month brings a new surprise. In August, in addition to the ongoing pandemic and protests, a major hurricane was added to the mix. What comes next is anybody’s guess. A zombie apocalypse? An alien invasion? At this point, the possibilities seem boundless. And the energy industry has been no stranger to this year’s turmoil, what with COVID-related demand destruction, an oil-price collapse, and production shut-ins. Amidst the chaos, the Department of Energy (DOE) announced that for the first time, private-sector energy companies would be allowed to store crude oil in the U.S.’s Strategic Petroleum Reserve (SPR), which resulted in the leasing of 23 MMbbl of capacity. Recently, those volumes have begun to be drawn back out. Today, we examine the factors influencing movements of crude oil into and out of the U.S. SPR.

Western Canadian producers have been deeply impacted by lower crude oil prices and the demand-destroying effects of COVID-19. This past spring, oil production in the vast region dropped by an estimated 940 Mb/d, or as much as 20% from the record highs earlier this year. Taking that much production offline helped in at least one sense: it eased long-standing constraints on takeaway pipelines like Enbridge’s Canadian Mainline, TC Energy’s Keystone Pipeline, and the government of Canada’s Trans Mountain Pipeline. Production has been rebounding this summer, however, and there are indications that pipeline constraints may be returning and apportionment of uncommitted space on some pipes may again become a persistent issue. Today, we continue a review of production and takeaway capacity in Alberta and its provincial neighbors with a look at apportionment trends on the biggest pipelines.

Not long ago, the economics for U.S. LNG exports were practically a no-brainer. Despite the longer voyage times and the resulting higher shipping costs from Gulf Coast and East Coast ports to Europe and Asia — by far the biggest LNG consuming regions — LNG priced at the U.S.’s Henry Hub gas benchmark presented a competitive alternative to other global LNG supply, much of which is indexed to oil prices, which were higher then. But earlier this year, as oil prices collapsed, COVID-19 lockdowns decimated worldwide gas demand, and international gas prices plummeted, the decision to lift U.S. cargoes has become much more nuanced, and the commercial agreements to support the development of new liquefaction capacity are much harder — if not impossible — to come by. Today, we discuss highlights from RBN’s latest Drill Down Report on the impact of recent market events on U.S. export demand, capacity utilization, and new project development.
In observance of today’s holiday, we’ve given our writers a break and are revisiting a recently published blog on the U.S.’s shifting role in the global LNG market. If you didn’t read it then, this is your opportunity to see what you missed! Happy Labor Day!

Yup. Pigs are critical to the safety and integrity of pipelines. Some are your basic utilitarian pigs, while others are quite smart, if not downright cool. No, these are not the pigs down on the farm. Instead, these pigs are devices run through pipes to clean, inspect, and support “batching” on hydrocarbon pipeline networks. They help ensure the safe and efficient transportation of crude oil, NGLs, petroleum products, and natural gas through more than 2.5 million miles of pipeline in the U.S. If you’re interested in energy and energy delivery, you’ve gotta know about pigs, and that's just what we'll be discussing in today’s blog.

The U.S. natural gas pipeline sector is entering a challenging period for recontracting a major chunk of its capacity. The numerous pipeline systems built during the early years of the Shale Era’s midstream boom were anchored by 10-year, firm shipper contracts, mostly with producers, making them so-called “supply-push” pipelines. Many of those initial contract periods have begun to roll off, exposing pipelines to producer-shippers’ renewal decisions based on current fundamentals. Shippers typically expect substantially lower rates for a renewal contract, because much of the pipeline has been paid off through depreciation. But there’s another issue that is becoming more important: shipper recontracting may not happen for market reasons. For pipeline owners, this is happening at the worst possible time. The market is in turmoil and facing ongoing uncertainty. Gas production is down, demand from LNG export facilities is in flux, and regional supply-demand dynamics are shifting. As if that weren’t enough, new, large-diameter pipelines out of the Permian now nearing completion will reshuffle gas flows around the country. And other transportation corridors that not long ago were bursting at the seams and feverishly expanding to ease constraints are now at risk of being underutilized. Today, we discuss the factors that together may present significant risk for pipelines approaching the proverbial recontracting “cliff.”

Pipelines are lifelines to refineries, steam crackers, and other consumers of energy commodities, and even the hint that a major pipeline may be shut down raises big-time concerns. For evidence, look no further than Enbridge’s Line 5, which batches light crude oil and a propane/normal-butane mix across Michigan’s upper and lower peninsulas and to points beyond. One of Line 5’s two pipes under the Straits of Mackinac is temporarily out of service, halving the 540-Mb/d pipeline’s throughput, and Michigan’s attorney general continues to pursue a lawsuit that, if successful, could be Line 5’s death knell. Enbridge also is facing a fight on its plan to replace the twin underwater pipes with a new, safer “tunnel” alternative. All of which raises the question, what would be the market effects if Line 5 is permanently closed? Today, we conclude a miniseries on one of the Upper Midwest’s most important liquids pipelines.

Understanding whether propane production is up or down over the past few months is a bit more difficult than you might think, depending on which set of EIA numbers you choose to look at. The U.S. Energy Information Administration provides monthly numbers on the last day of the month lagged by about two months, and weekly numbers on Wednesdays, lagged by only five days. Both time series are closely watched by the propane market to assess the availability of supply for retail customers, petrochemical feedstock demand, and exports. Usually, these two sets of numbers move in tandem. But not always. The monthly numbers show production down by about 70 Mb/d from April to June, which is what you would expect given what was happening with crude and gas production at that point in time. Yet EIA weekly production numbers showed production increasing by about 90 Mb/d for the same period. So which way is propane production really trending? If you want to understand what’s going on, and you don’t mind delving into some deeply wonky NGL analytics, hang on for today’s blog.

In May of this year, Western Canada’s oil production shut-ins due to weak demand and poor pricing were estimated to have peaked near 1 MMb/d, resulting in a 20% drop from the near-record production levels reached only a few months earlier. The magnitude of the production fall in such a short period of time caused a significant drop in the utilization of pipelines that transport crude oil from Alberta to other parts of Canada and the U.S. All of a sudden, pipelines that had been heavily rationing their capacity over the past couple of years to accommodate steadily rising production suddenly had ample spare capacity. With those supplies now on the road to recovery, pipelines have begun to fill some of that extra space and are moving toward rationing capacity once again. Today, we continue our review of Western Canadian production and takeaway capacity with a look at how this spring’s production cuts affected the region’s biggest pipelines.

About two-thirds of all of the propane consumed in the U.S. is used as fuel — for indoor and outdoor cooking, home heating, water heaters, drying crops, and running forklifts and fleet vehicles. The other one-third is used as a feedstock for producing ethylene and other petchems. About 95% of the propane supply to meet this demand is produced and processed right here in the U.S. of A., making propane the most American fuel we’ve got. But when firing up the grill out back and watching that first propane molecule flash to life, most backyard chefs don’t think much about the long and winding road their propane has traveled. It’s actually a fascinating tale of supply-chain logistics that involves high pressures, bitter cold, wild rides up and down tall towers, storage deep underground, and, of course, trains, trucks, and tanks. We think it’s a tale that needs to be told, and that’s what we’ve been doing in this update of another Greatest Hit blog.

Just as U.S. LNG exports were beginning to recover from months of market-driven cargo cancellations, major Hurricane Laura has cut the rebound short. With Laura taking aim at the Texas-Louisiana border — the location of two large-scale LNG export terminals, including the U.S.’s largest export facility, Cheniere Energy’s Sabine Pass Liquefaction terminal — total feedgas flows to U.S. terminals the past two days dived to fresh lows for 2020 and the lowest since February 2019. Gas production is also way down, with offshore Gulf of Mexico production shut-ins compounding the effects of already depressed drilling and completion activity this year. But production has the potential to rebound more quickly than LNG exports, which could exacerbate the onshore demand effects of the storm; It already will bring cooler weather and drench gas demand for power generation as it moves inland over the Southeast and into the Mid-Atlantic states. Today, we look at how LNG exports are being affected by the storm and what that could mean for the overall gas market balance in the coming days.

Yet again, the Texas-Louisiana coast is bracing for a hurricane that has the potential to be really bad, not just for the people and homes in the storm’s path, but for the region’s all-important energy sector. Hurricane Laura will be crossing a swath of the Gulf of Mexico dotted with oil and gas production platforms, and is headed for an area chockablock with tank farms, refineries, and steam crackers, as well as export terminals of every stripe: crude oil, refined products, ethane, LPG, and LNG. There’s a good chance there’ll be a lot of disruption to many energy-related activities for at least the balance of this week — and maybe longer — but one of the biggest hits could come to Mont Belvieu, TX, the center of NGL storage and fractionation. Today, we discuss how the storm might affect not only storage at the U.S.’s largest NGL hub, but gas-processing activity hundreds of miles inland.

Not long ago, the economics for U.S. LNG exports were practically a no-brainer. Despite the longer voyage times and the resulting higher shipping costs from Gulf Coast and East Coast ports to Europe and Asia — by far the biggest LNG consuming regions — LNG priced at the U.S.’s Henry Hub gas benchmark presented a competitive alternative to other global LNG supply, much of which is indexed to oil prices, which were higher then. But earlier this year, as oil prices collapsed, COVID-19 lockdowns decimated worldwide gas demand, and international gas prices plummeted, the decision to lift U.S. cargoes has become much more nuanced, and the commercial agreements to support the development of new liquefaction capacity are much harder — if not impossible — to come by. Today, we discuss highlights from RBN’s latest Drill Down Report on the impact of recent market events on U.S. export demand, capacity utilization, and new project development.