Natural gas production is growing faster in the Marcellus and Utica than any other part of North America. Even with lower prices, Appalachia natural gas production will probably hit record highs in the next few days, and NGL production is into the stratosphere, now more than four times where it was two years ago, growing on average 6% PER MONTH! All of that new production requires lots of new gathering, processing and pipeline infrastructure and consequently midstream construction in the region has been booming. But building midstream infrastructure in Appalachia doesn’t work the way it does in other high-growth shale plays. The region has lots of huge, legacy natural gas pipelines that are being repurposed, new gas plants and fractionation that must be build, and a paucity of underground salt formations needed for high-volume NGL storage. Today we get further into the details of Marcellus/Utica infrastructure, starting with natural gas pipelines.
Today’s blog introduces RBN Pipeline, a new Geographical Information System (GIS) capability provided for RBN members and Backstage Pass subscribers. For more information, click on the maps below.
This is Part 3 of our blog series covering the latest developments in Marcellus/Utica midstream infrastructure. In Part 1 we described the huge growth in Marcellus/Utica natural gas production since 2010 and the subsequent expansion in natural gas liquids (NGL) production from Marcellus and Utica wet gas when many drillers switched their focus to liquids in 2011 (see Join Together With Demand). Part 2 provided an overview of Marcellus/Utica geography. We discussed how even though these two shale formations cover most of Pennsylvania, West Virginia, Eastern Ohio and parts of other states, it turns out that most of the production comes from only 20 or so counties across those states. Such geographic concentration has significant implications for regional infrastructure development and take-away capacity.
Our ultimate aim in this blog series is to examine the unique aspects of the Marcellus/Utica region that have spurred midstream companies to build gas processing infrastructure from a small group of stand-alone plants into a fully integrated system designed to operate without the luxury of significant NGL storage capacity. The clue to this intent is in our title - “Join Together With Demand” – designing infrastructure to join supply to demand with fault tolerance as a foundation of the design.
The challenge in any analysis of Appalachian infrastructure is that it is complicated. Some of the natural gas pipelines crisscrossing the region have been there for more than one hundred years, but now sit in the back yard of the most prolific shale gas producing region in the country. Others are some of the largest capacity pipes in the U.S., developed almost seventy years ago to move volumes from Texas, Louisiana, Oklahoma and other traditional producing states into the Northeast – a service no longer required. These pipelines also traverse the Marcellus/Utica producing regions and have for the past few years been preparing to reverse their flows – to bring Appalachian gas to markets as far south as the Gulf Coast.
It is a quite different story for natural gas processing. In the five years since gas production took off in the Marcellus/Utica, gas processing capacity in the northeast has expanded nearly 13 times from 600 MMcf/d to 7,600 MMcf/d. More than 30 new plants and expansions of existing plants have come on line, and another 25 plants/expansions are in some stage of planning and development. Several new NGL pipelines have been built to connect these plants to fractionators and de-ethanization facilities. (Unlike most other parts of the country, in much of Appalachia, the process of splitting mixed NGLs into purity products is handled by de-ethanizers that separate ethane from the other NGLs, and C3+ fractionators that split out the other four NGLs—propane (C3), normal butane (NC4), isobutane (IC4) and natural gasoline (C5+). For more information on see Talkin’ ‘Bout My F-F-Fractionation.)
To get a solid understanding of how the legacy natural gas pipelines, new gas processing plants, C3+ fractionators, de-ethanizers and NGL pipelines work together you need to see all the facilities on the same map at the same time. That turns out to be more of a challenge than you might think – because most industry maps tend to focus only on one commodity or type of facility, or they are provided by a single company in their investor presentations and only show that company’s facilities. Thus it is difficult to get an integrated picture of the entire midstream infrastructure of the region. While there are services available that provide the tools to build your own maps that pull all of these facilities together, you better have a GIS person (geographical information system technician) to handle the mechanics. That is, until now. To help with our analysis of Marcellus/Utica midstream assets, today we are introducing a new website mapping capability. We are calling this new tool RBN Pipeline, since (a) it is mostly used to display pipelines, (b) it shows what is in the pipeline (meaning in development) and (c) Pipeline is one of our favorite instrumentals from the early 60s. (It was recorded by the Chantays in 1962, later covered by the Ventures and many other artists). In the paragraphs below we will use RBN Pipeline to examine natural gas pipelines in the region.
Marcellus/Utica Natural Gas Pipelines
Outside Texas and Louisiana there is no region with more gas pipelines than Appalachia. There are nineteen interstate pipelines in the region, most initially designed to bring gas into the Northeast market. We are focused on only eight of those pipelines – the major systems that cut through the two producing areas described in Part 2 - the Northeast Pennsylvania region (green blob in Figure #1) and Southwest Pennsylvania, West Virginia and Ohio (yellow blob in Figure #1). All of the new gas processing plants are in or very near the yellow blob, because that is where the wet gas is located. Gas in the green blob is almost exclusively dry.
The eight pipelines we will cover here move the vast majority of Marcellus/Utica gas across and out of the region. We split them into three groups:
- Spider-web systems. These are network-like pipeline systems that were developed early in the 20th century (yes we do mean 20th) to connect Appalachian gas production to demand – mostly local distribution companies (LDCs) and to regional gas storage facilities.
- T-Pipes. Three major long-line pipelines from the Texas and Southeast/Gulf region that have traditionally moved most of the Northeast’s gas supplies into that market. The names of all three of these pipelines just happen to start with the letter ‘T’, thus the moniker “T-Pipes”.
- Other. Two other major pipelines bringing gas into the region that do not fit in the previous categories.
Spider-Web Systems
We will start with the spider-web systems. All three of these systems are morphing themselves from functioning primary as wide-area distribution systems connecting supplies from outside the region to storage and demand into header systems, providing take-away capacity for Marcellus/Utica producers to move out of the region on various interconnected pipelines.
One of the most important pipelines in the region is Dominion Transmission, Inc., (DTI), owned by Dominion Resources, Inc., a diversified energy company that owns a number of utilities. DTI operates a 7,800 mile network of pipelines covering six states that incorporates one of the largest natural gas storage facilities in the world with 947 Bcf of storage capacity. Traditionally the system received gas from various pipelines moving gas from Texas and the Southeast/Gulf region, and served utilities in Ohio, West Virginia, Pennsylvania and Maryland. As shown in Figure #1, DTI is dead center of the prolific “yellow blob” of production in SW PA, WV and OH. DTI also extends up into the “green blob” of NE PA, although capacity between those two pieces of its system is constrained.
Note: if you click on Figure #1 it will take you through to RBN Pipeline. There you can zoom, scroll and add other pipelines and features to the map. Instructions are provided with the map. When finished click return to get back to this blog. Note that if you have a slow internet connection, you may have problems accessing RBN Pipeline. These maps require a minimum level of bandwidth to function correctly.
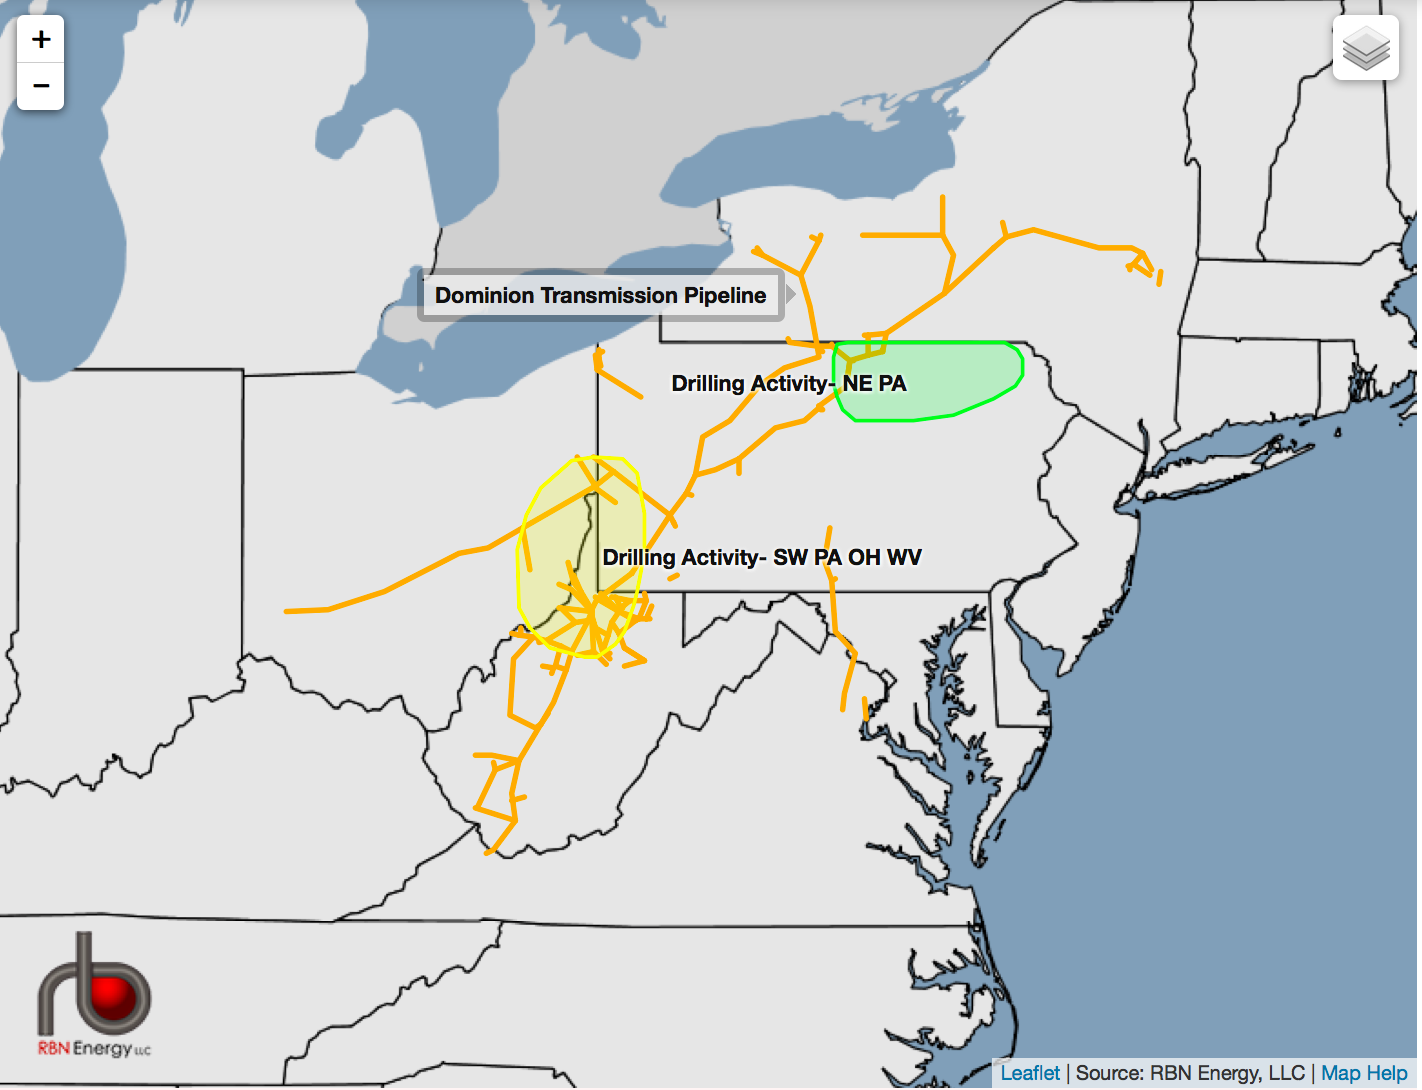
Figure #1 – Spider Web Pipes – Source – RBN (click to open RBN Pipeline System)
Columbia Gas, the second spider web system known as TCO, has been owned by NiSource, Inc since 2000, but is included in the group of NiSource companies being folded into a new NYSE listed company, Columbia Pipeline Group. The abbreviation TCO is said to have its inception many decades ago as Transmission Company, when Columbia Gas functioned primarily to bring gas to several LDCs owned by Columbia in the region. Traditionally Columbia Gas received most of its supplies from sister pipeline Columbia Gulf, which brought gas from the Gulf Coast and interconnects with TCO at Leach, KY. Click through Figure #1 to the RBN Pipeline window and check the Columbia Gas (TCO) box to see the system. Note that it is an even more encompassing system than DTI, and has a huge footprint in Ohio and the “yellow blob” that extends into SE PA and WV. As such, large volumes of Utica and Marcellus gas move across TCO.
The third spider web system is EQT Midstream, owned by EQT Corporation. Click through Figure #1 to the RBN Pipeline window and check the EQT pipeline box to see the system. EQT has operated in Appalachia for more than 100 years and is one of the largest producers in the region. The system includes almost 11,000 miles of gathering lines, most of which connect into the pipeline that runs from northern WV up through SW PA. Like the other two spider web systems, EQT cuts through the “yellow blob” sweet spot of Marcellus/Utica production. However, EQT is much smaller than DTI and TCO with limited capacity available in the region.
T-Pipes
The first of the T-Pipes, is TETCO, or Texas Eastern Transmission Co., owned by Spectra Energy Corp. Spectra traditionally moved gas from Texas and Louisiana to the Northeast, supplying New York, New Jersey and connecting to its sister pipeline Algonquin to serve New England (See our series Don’t Give Up on Us for more information about the areas supplied via Algonquin). From its traditional role as a supply system, its role has changed since it cuts right through the middle of the “yellow blob” in SE PA, WV and Ohio. Consequently it has become an important conduit for Marcellus/Utica gas leaving the region. Figure #2 below takes you to the RBN Pipeline window opened to the TETCO map. Note you can scroll all the way back to the traditional Gulf Coast sources of the pipeline.

About the song
“Join Together” was written by Pete Townshend. The song was originally intended to be a part of The Who’s Lifehouse project, an unfinished science fiction rock opera that Pete Townshend was writing as a follow-up to Tommy. Recorded at Olympic Studios in London in May 1972, “Join Together” was released as a single in June 1972. Produced by The Who with Glyn Johns, it went to #17 on the Billboard Hot 100 Singles chart. The song has been included in several Who compilation albums, beginning with the Hooligans double hits album released in September 1981. Personnel on the record were: Roger Daltry (lead vocals, harmonica), Pete Townshend (guitar, synthesizer, Jew's harp, backing vocals), John Entwistle (bass, backing vocals), and Keith Moon (drums).
Hooligans is a double compilation record of hits from The Who running from 1964 to 1978. Released in September 1981, the LP went to #52 on the Billboard 200 Albums chart and has been certified Gold by the Recording Industry Association of America.
The Who are an English rock band formed in London in 1964. Its core lineup was Roger Daltry on lead vocals, Pete Townshend on guitar, John Entwistle on bass, and Keith Moon on drums. They are considered by many to be one of the most influential rock bands of the 20th century. They have released 12 studio albums, 16 live albums, four soundtrack albums, 27 compilation albums, four EPs and 58 singles and have sold over 100 million records worldwide. The Who are members of the Rock and Roll Hall of Fame and UK Music Hall of Fame, and are the recipients of a Lifetime Achievement Award from the Grammy Foundation. Roger Daltry and Pete Townshend received Kennedy Center Honors as members of The Who in 2008. Daltry and Townshend have both released solo albums over the years, and both continue to record and tour as The Who. The Who are currently on the road with The Who Hits Back! tour in the UK.


Comments
Nice new feature here. It will be good if you can add processing plants, NGL lines, refineries, etc. It was a pleasure working with your team when they came in for diligence on American Energy - Utica. You guys know your stuff and I couldn't agree more that a well designed map is worth a 1000 words.
Keep up the good work!
Adam Wilson
In reply to Good Work by Adam Wilson
Thanks much. All of those features are coming. We'll be looking at Northeast plants and NGL lines in the next episodes of this series.