The Energy Information Administration (EIA) yesterday (Thursday) reported the U.S. natural gas storage inventory is 3,877 Bcf as of Oct. 23, which is above the 5-year maximum for this week and within striking distance of breaching the all-time record high of 3,929 Bcf (Nov. 2, 2012) by the end of the traditional storage injection season on Oct. 31. And, while the production growth rate has slowed compared to recent years, and even dipped a bit over the past couple of weeks, total gas production is still near record levels and about 2.0 Bcf/d higher than last year. Now the gas market is about to flip to withdrawal season, when winter heating demand typically exceeds available local production, leading to storage drawdowns. The combination of high storage and production levels sets up a bearish dynamic for the winter market. Today, we take a look at the supply and demand balance going into the winter gas market.
Our last update on the natural gas supply and demand balance was at the end of August 2015 (see Hold Me Tight). At that time the market had worked off some of the supply surplus it started with back in April. At the start of the summer injection season in April there was 600 Bcf more gas in storage and production was 4.0 Bcf/d higher than last year. By August end, near-record demand from power generators and flattening production helped to whittle down the year-over-year storage overhang to just under 500 Bcf. Since then, demand has maintained record highs each month. And, while average production set a new record in September, year-over-year increases continued to flatten out.
Table 1 shows how the gas market balanced this summer compared to last year using pipeline flow data from our friends at PointLogic Energy. The table is a supply/demand balance showing this year’s summer -to-date average (middle column) and the difference from the same period in 2014 (right column). All volumes in the table are in billion cubic feet per day (Bcf/d). We’ll look at each of the supply demand components in turn.
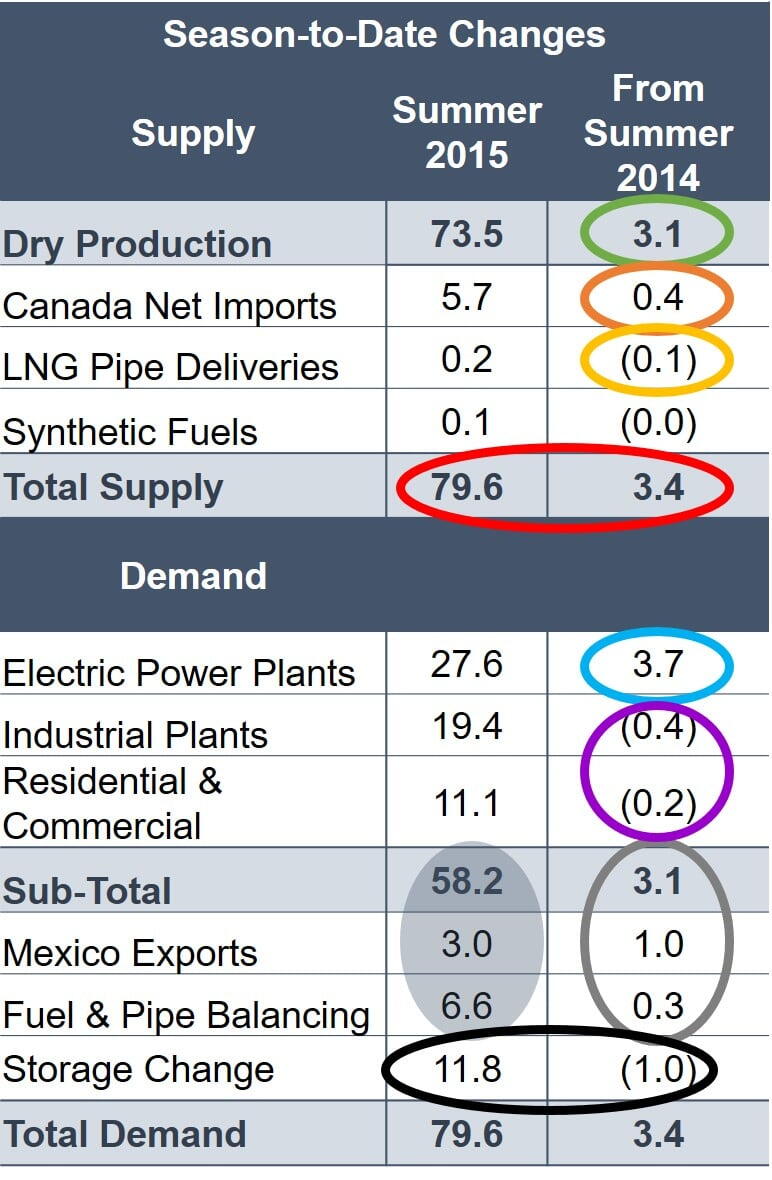
Table 1; Source: PointLogic Energy, RBN Energy
Market Supply
Lower-48 dry gas production (including both dry gas at the wellhead and residue gas from gas processing plants) remains the primary driver of supply growth on the supply side, averaging 73.5 Bcf/d this summer to date, which is about 3.1 Bcf/d higher compared to 2014 (green circle). That year-over-year gain has narrowed from where it was earlier in the year. Production started this year at an average 71.8 Bcf/d in January, over 5.0 Bcf/d higher than last year. From there, production grew nearly 2.0 Bcf/d to 73.3 Bcf/d by April, which was a 4.4 Bcf/d surplus to last year. But output flattened through the first half of summer as low prices prompted producers to scale back drilling activity and curtail well completions while they waited for drilling service cost reductions and additional takeaway capacity out of the Marcellus/Utica region. As a result, year-over-year gains narrowed to 2.7 Bcf/d by July. Volumes picked up again in late summer, with production growing nearly 1.0 Bcf/d between July and September to a record of 74.2 Bcf/d, which is 3.6 Bcf/d above September 2014. Gains were primarily driven by Northeast production, particularly the Utica (see Dry County). Since then volumes have retreated again near August levels to average 73.7 Bcf/d in October to date, partially due to shoulder-season maintenance work. Volumes look to be off at least 1.0 Bcf/d from September in the past couple of weeks. By comparison, last October, production had climbed 0.7 Bcf/d month-over-month to 71.7 Bcf/d. Thus the year-over-year gap has narrowed to around 2.0 Bcf/d this month to date (as of Oct. 26).
Net imports from Canada were up on average as well at 5.7 Bcf/d, 0.4 Bcf/d higher than last summer (orange circle), with the incremental supply going primarily to the U.S. West where Canadian supply remains competitive. Additionally, the West relies on snowmelt and precipitation for hydroelectric generation during the summer, and lagging water supply this summer required higher gas-fired generation to meet electricity demand. LNG terminal pipe deliveries (send-out) continued to slide toward zero, averaging 0.1 Bcf/d lower at about 0.2 Bcf/d (orange circle). That brings total supply to 79.6 Bcf/d, 3.4 Bcf/d higher than last summer (red circle).
Market Demand
On the demand side, total U.S. consumption (Sub-Total line item in the table) averaged a little over 58 Bcf/d this summer, up 3.1 Bcf/d from last summer (blue circle). Demand from industrial plants and residential/commercial (res/comm) buildings averaged a combined 0.6 Bcf/d lower than last summer (purple circle). But gas demand for electricity generation plants (power burn) was up 3.7 Bcf/d over last summer at an average 27.6 Bcf/d. That is just 0.3 Bcf/d shy of the summer average record of 27.9 Bcf/d seen in 2012. Additionally, cooling degree days, which are an indication of natural gas needed for cooling for every degree above 65 degrees Fahrenheit, totaled 117 higher this year than last summer but were 44 shy of 2012. But historically low gas prices, increasing coal fired plant retirements and incremental gas-fired generation capacity have led to higher power burn this summer. In fact, power burn hit record highs in September (~28 Bcf/d) and October (24.7 Bcf/d). Power demand across the border in Mexico also soaked up incremental supply this summer, pushing up U.S. exports to Mexico (see All the Gas Went to Mexico). Adding up the values in the gray shaded circle for gas lost to fuel and pipe balancing (6.6 Bcf/d), exports to Mexico (3.0 Bcf/d) and U.S. consumption sub-total (58.2) the total demand this summer not including storage comes to an average 67.74 Bcf/d, up a combined 4.4 Bcf/d from last summer (gray circle).
That brings us to the gas market’s great balancing mechanism – storage. When the total of consumption and exports is balanced against total supply, the supply/demand table tells us that 11.8 Bcf/d was available to inject into storage this summer, which is 1.0 Bcf/d less than last summer (black circle). What does that mean for inventory levels as we head into winter? The gas market relies on gas stored during summer to help meet the incremental demand during winter heating season (November through March). Thus, the market regards the summer-ending inventory level reported by the EIA as of November 1 as a key leading indicator of how winter fundamentals and prices will fare. A relative deficit in storage would lead to higher gas prices and prompt increased production and/or imports from Canada to meet demand. Too much in storage and a lack of sufficient demand could leave the market further in glut by the time summer injection season rolls around April 1.
PointLogic’s supply/demand balance table tells us demand has been higher than supply this summer compared to last. As a result less surplus gas ended up injected into underground storage this year (nearly 219 Bcf less over the course of the summer according to the EIA weekly storage data as of its Oct. 23 inventory data).

About the song
“A Hazy Shade of Winter” by Simon & Garfunkel, was released in October 1966, initially as a stand-alone single, but subsequently included on the duo's fourth studio album, Bookends (1968). The song peaked at number 13 on the Billboard Hot 100. In 1987, The Bangles recorded a cover version of the song for the Less Than Zero soundtrack; that version peaked at number two on the Billboard Hot 100.