Blood, Sweat & Tears 1969 hit, Spinning Wheel tells us: “What Goes Up, Must Come Down”, and U.S. propane stocks are no exception. Having built to a record 106 MMBbl the week of November 20, 2015, (according to the Energy Information Administration – EIA), storage congestion became the topic of the day, but while this record is noteworthy, what is far more significant is the rapid descent propane stocks have taken since late November in spite of the 2015-16 El Nino “winter of no winter”. This is the second non-winter that the U.S. has experienced over the past five years, the last one occurring in 2011-2012. However, there are big differences in today’s market dynamics relative to 5 years ago, namely propane exports to the tune of 850 Mb/d. In today’s blog, we’ll walk through the market dynamics that have resulted in extremely steep propane stock draws since late November 2015.
It is no secret that propane production has been running strong as a result of the shale gas boom and we’ve previously detailed the implications of growing supply from gas processing plants which has more than doubled from 565 Mb/d in January 2010 to 1,135 Mb/d in December 2015 (down slightly from the peak of 1,167 Mb/d in October 2015). We covered the growing supply of propane, falling prices and increasing export volumes in Sail Away, the impact weather has on propane markets in A Perfect Storm, and how prices impact propane as a petrochemical feedstock in Beyond Hypothermia. In addition, RBN produced a comprehensive study for the Propane Education and Research Council (PERC) in 2015 to assess how propane market developments could impact the prospects for disruptions similar to those that occurred during the “Perfect Storm” winter (2013-14), a summary of which was published in our Drill Down Report: Next To You and an extensive blog series including Can’t Get Next To You. We’ve also covered the impact falling crude prices are having on NGL markets; including propane with respect to supply and demand, pricing, infrastructure and petrochemical margins in our Drill Down Report: It's Not Supposed To Be That Way (Part 1) and (Part 2) and our blog series which included Developing NGL Supply/Demand And Price Scenarios.
We start today by looking at this winter’s extremely steep propane stock draws since late November in the context of the previous 5 years of history. Figure #1 shows EIA weekly ending U.S. stocks of propane and propylene from January 2011 through March 2016. The red circle to the far right of the chart highlights the current steep stock draws. Total U.S. stocks fell from 106 MMBbl the week of November 20, 2015 to only 62 MMBbl the week of March 4, 2016. That is a 44 MMBbl draw over 15 weeks. For a perspective regarding how much of that draw is propane vs. propylene, during the week of November 20, 2015 the U.S. had 3.4 million barrels of ‘Propylene for Nonfuel Use’ in storage, as of the week of February 26, 2016 that number stood at 2.8 million barrels. In other words, propylene stock draws are a round off error relative to propane draws.
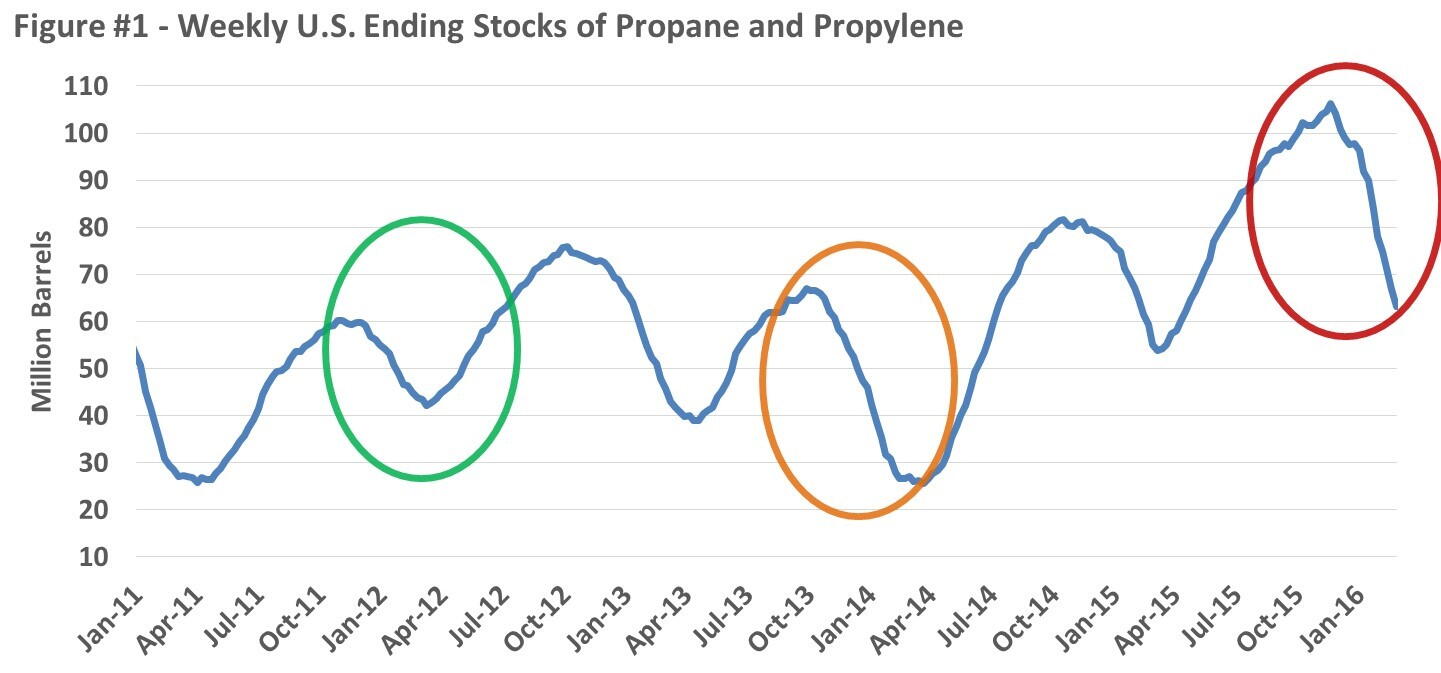
Figure #1 - Source: EIA;

About the song
"Spinning Wheel" is the title of a popular song from 1969 by the band Blood, Sweat & Tears. The song was written by the band's Canadian lead vocalist David Clayton-Thomas and appears on their self-titled album.