Five years ago, the U.S. was a net importer of propane and butanes, those products collectively called LPG, or liquefied petroleum gasses. Back then, demand from residential, commercial, refining and chemical markets slightly exceeded supply for the products. But then came shale, and LPG production from natural gas processing more than doubled, from 0.8 Mb/d to 1.7 Mb/d. Suddenly the U.S. was a net exporter—a very big exporter at that. Last year roughly half of all LPG from U.S. gas processing plants was exported, with the vast majority shipped to overseas markets. All those exports are now having an outsized impact on pipeline flows, inventories and prices. Consequently, it is increasingly important to keep close tabs not only on export volumes but on which export terminals are handling all these volumes, and where the LPG is heading. Today we discuss the current state of the LPG export market and insights on it from RBN’s most recent NGL Voyager Report. Warning, today’s blog includes a subliminal promo for the report.
Before we get started, a couple of definitional items for you energy fundamentals data geeks. At RBN, we define U.S. LPG as three members of the natural gas liquids (NGLs) family of products: propane, normal butane and isobutane. All three are produced from two sources: 1) the 800 or so natural gas processing plants in the U.S., and 2) U.S. refineries. About 75% of LPG production comes from processing plants, and those facilities have been responsible for almost 100% of the growth in LPG production over the past five years. Refinery production has been about flat. On an annual basis, refineries use more normal butane and isobutane than they produce. So really, refinery net LPG production is propane. Note also that the Energy Information Administration (EIA) uses a slightly different definition of LPG, including ethane in the total. Furthermore, when showing product balances, EIA includes the petrochemicals propylene with propane, butylene with normal butane, and isobutylene with isobutane. Just something to keep in mind when you are comparing numbers from one source to another.
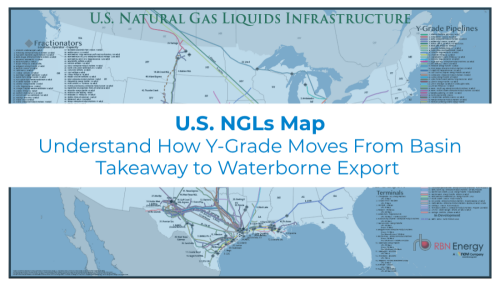
Visualize the infrastructure behind U.S. NGL movement.
The U.S. NGLs Map provides a comprehensive view of the transport, processing, and export networks moving NGLs across the U.S.
Monthly data from EIA dating back to 1994 show that the U.S. was a net importer of LPG (EIA’s definition) every single month until August 2009, when the U.S. net exported 10 Mb/d. That was the only month that year when the U.S. was a net exporter of LPG, but the market had shifted, and during four months in 2010 the U.S. exported a net of about 22 Mb/d. As shown by the blue line in Figure 1, net exports continued to ramp up, and in 2012 the U.S. was a net exporter of LPG each and every month at an average monthly rate of nearly 56 Mb/d. Thus, in the span of only three years the U.S. LPG market was transformed from a consistent importer of propane and normal butane to a constant net exporter. (Note that almost all of these exports and imports were propane and normal butane. Imports and exports of isobutane are minimal. There were no ethane exports until 2014, and in 2016 they still averaged less than 100 Mb/d.)
But for LPG as a product category, those net exports early in this decade were just the tip of the iceberg. By 2016, net exports of LPG had risen to an average of 850 Mb/d, more than 15 times (!) the exporting pace in 2012. And given that during the period from 1994 through 2009 the U.S. imported an average of about 160 Mb/d of LPG, through last year the market experienced a net swing of imports-to-exports of more than 1 million barrels per day (MMb/d). Impressive stuff. And export volumes have kept on increasing, hitting all-time records, even during the middle of this year’s peak LPG demand season––the home heating market for propane and the winter gasoline blending season for butane. More on that later in this blog.

About the song
“Come On Down to My Boat” was a 1967 hit single for Every Mother’s Son written by Wes Farrell and Jerry Goldstein. The tune peaked at #6 on the Billboard Hot 100 in May 1967. The group was a one hit wonder, and disbanded in 1968.