Not long after crude oil prices crashed in 2014, natural gas processing economics hit the skids. From late 2014 through the first half of 2017, times were tough for natural gas processors and the producers processing natural gas to extract NGLs in their plants. That’s because the per-MMBtu price difference between natural gas prices and NGL prices was low. Very low. In fact, during 2015-16, it was the lowest it’s been over the past decade except for a brief period during the 2009 financial meltdown. But things are looking up. Thanks to a big boost in from propane and butane prices — and, to a lesser extent, rising ethane and natural gasoline prices — natural gas processing economics look healthier today than they have in years. It is going to get even better as more new ethane-only steam crackers come online. Given these developments, it is clearly time for another deep dive into what makes gas processing economics work, and how the numbers are about to change. Today, we begin our latest expedition into the wilds of gas processing.
Before we get into what is happening today, we need to do a bit of historical market recap of the relationships between U.S. crude oil, natural gas and NGLs to set the context for recent developments. Figure 1 shows the price trends of these three energy commodity groups over the past 10 years. The natural gas price is at Henry Hub (blue line); crude oil is benchmark West Texas Intermediate (WTI) at Cushing, OK (black line); and NGLs (green line) are at the Mont Belvieu, TX NGL hub. Since there are five NGL purity products — ethane, propane, normal butane, isobutane and natural gasoline — the NGL line is a weighted average of a “typical” NGL barrel.
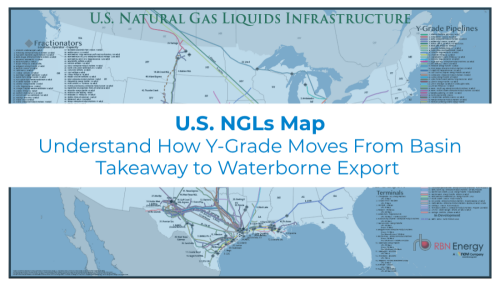
Visualize the infrastructure behind U.S. NGL movement.
The U.S. NGLs Map provides a comprehensive view of the transport, processing, and export networks moving NGLs across the U.S.
The chart starts back in 2007, just before the Shale Era started to impact the markets in earnest. Back in those ancient times, which we call Pre-Shale (yellow box to left), the prices of crude oil, NGLs, and natural gas tended to track each other, running up with the commodity frenzy of 2008 and crashing with the financial crisis of 2009. Note that during most of this period there was some daylight between the gas line and the NGL line. We’ll get back to why that’s important in a minute.
As the economy started to recover in 2010, crude prices started to rebound, and NGL prices moved up in sympathy. From year-end 2009 to 2012, the price of crude oil increased from $46/bbl to as high as $108/bbl and NGL prices rose from $6.28/MMBtu to as high as $16.61/MMBtu. But in natural gas markets, the Shale Era had come on with a vengeance, leading to an oversupplied market and flat-to-declining natural gas prices. We call this the Shale Gas period (blue box). Natural gas prices averaged $4.03/MMBtu during 2011 and $2.83/MMbtu in 2012, down from an average of $8.92/MMbtu in 2008. Thus, during 2011-12, a huge gap developed between the price of NGLs (and crude oil for that matter) and the price of natural gas — this was the period we called at the time The Golden Age for gas processors. Gas processors were, in effect, converting very cheap molecules in the raw gas stream into much more expensive NGL molecules by pulling those NGLs out of the gas stream. Depending on the commercial arrangements between the parties, it was hugely profitable for either the processor, the producer or both. But you know what happened next, right? With NGLs (and crude oil) worth so much more money, producers shifted their drilling budgets to shale plays with a higher percentage of “wet” or high-Btu gas containing lots of NGLs, and to crude oil, which comes along with associated gas that contains lots of NGLs. And so NGL production skyrocketed.
About the song
“My Generation” was written by Pete Townshend and appears as the sixth song on side one of The Who’s debut album of the same name. The song was released as a single in November 1965. It went to #74 on the Billboard Hot 100 Singles chart in the U.S., but soared to #2 on the UK charts, making it the highest-charting single for The Who in Britain, along with “I’m a Boy” in 1966. Personnel on the record were: Roger Daltry (lead vocals), Pete Townshend (guitar, backing vocals), John Entwistle (bass, backing vocals) and Keith Moon (drums).
The album My Generation was recorded at IBC in London from April to November 1965, with Shel Talmy producing. Released in the UK in December 1965, the album was released in the U.S. in April 1966 with a different cover picture and a slightly different track listing under the title The Who Sings My Generation. It failed to chart in the U.S., which is ironic since many critics since its release have rated it as one of the best rock records of all time. It has been re-released in various versions and different formats over the years. Four singles have been released from the LP.
The Who are an English rock band formed in London in 1964 by Roger Daltry, Pete Townshend, John Entwistle and Keith Moon. They developed from an earlier mod R&B group with the same members called The Detours. The Who identified with both the mod and pop art movements in Britain in the 1960s. The group used the on-stage destruction of guitars, amplifiers, and drums as part of their performance art.
Pete Townshend and John Entwistle were among the earliest users of Marshall stack amplifiers, designed by Jim Marshall in his London shop in 1962. The Who have released 12 studio albums, 16 live albums, 27 compilation albums, four soundtrack albums, four EPs and 58 singles. They have sold more than 100 million records worldwide. The band was inducted into the Rock and Roll Hall of Fame in 1990 and the UK Music Hall of Fame in 2005. Daltry and Townshend received Kennedy Center Honors in 2008. Keith Moon died in 1978 and was replaced by Kenney Jones until 1988. (Jones also reunited with the band for a benefit concert in 2014.) John Entwistle died in 2002. Current touring musicians include Zak Starkey (drums), Simon Townshend (guitar, backing vocals), Loren Gold (keyboards, backing vocals), and Jon Button (bass). The Who continue to record and tour. They are currently on a North American tour — “The Who Hits Back!” — with dates booked until November.