European refiners have shut down 1.7 MMb/d of capacity since 2008 in response to recession plagued economic conditions at home and competitive pressures in their traditional export markets. Refinery utilization in Europe is down to 75 percent (IEA Q1 2013). That contrasts sharply with high utilization, record exports and respectable product margins at US refineries - even as crude prices increase. Today we examine why Europe’s refineries are suffering.
Just over a year ago in “Don’t Let the Sun Go Down Part 1” we were looking at the miserable crude economics that seemed certain to cause US East Coast refiners such as Sunoco Philadelphia to head for the exits. The advent of crude-by-rail and subsequent access to lower priced Bakken crude have helped resuscitate those refiner’s prospects (see Beginning to See the Light). More generally, lower priced US domestic crudes and a strong export market for refined products have made US refiners relatively profitable. Refinery utilizations in the US Gulf region (Petroleum Administration Defense District - PADD 3) are running at over 90 percent this month according to Energy Information Administration (EIA) data because these refineries are taking advantage of cheaper domestic crude supplies arriving from the South Texas Eagle Ford and North Dakota Bakken oilfields and exporting record volumes of gasoline and diesel. The US refining party is also being fueled by cheaper natural gas used to provide heat and hydrogen needed to process crude.
Meantime, across the pond, things are not looking so pretty for European refiners. For one thing unlike their US counterparts, there is no supply of cheap tight oil crude from shale for them to tap into. The majority of European refiners import crude from Russia, Africa and the Middle East and pay prices linked to the international benchmark North Sea Brent crude that has been more expensive than US domestic crude for the past two years (see any of our blogs on the Brent/West Texas Intermediate spread the most recent being “Reunited”). European refinery fuel costs are higher than those in the US because off-gasses and intermediate products produced from crude oil are typically used as refinery fuel instead of natural gas. (And natural gas is much more expensive in that market anyway.) As much as 7 percent of each barrel of crude processed is consumed that way. With current crude prices over $100/Bbl that cost is more than $7/Bbl. US refiners enjoy far lower fuel costs (Valero recently estimated these costs at $1.10/Bbl using natural gas priced at $4/MMbtu).
But a larger challenge for European refiners has been declining demand for refined products since 2006 as a result of ongoing economic weakness since before the financial crisis. Data from the International Energy Agency (IEA) indicates that European refined product demand fell by 14 percent between 2006 and 2013. A recent survey prepared for the UK Petroleum Industry Association by IHS (copy here) forecasts only a 4 percent increase in European refined product demand between 2011 and 2030. Within the declining demand numbers are two strong trends – increasing demand for diesel and declining demand for gasoline. Those trends are the result of government incentives that favor diesel over gasoline for transport. However, European refinery configurations are not up-to-date with the changing market demand for products because they were largely constructed in the 1960’s and 1970’s. Refineries designed to maximize gasoline production can’t keep up with the demand for diesel. Europe has therefore become a net importer of diesel and has a surplus of gasoline supplies.
European refineries do not produce enough diesel to meet regional demand even though the margins they could realize for doing so would be comparable to US Gulf returns. The chart below shows the refinery “crack” between North West Europe 10 parts per million ULSD and ICE Brent crude oil (blue line) and the US equivalent (green line). The European crack is North West Europe ULSD price in $/Bbl minus Brent. The equivalent US values are for US Gulf Coast ULSD versus LLS crude. The US average crack in 2013 is $15.5/Bbl versus Europe at $16.3/Bbl meaning that European refiners are incentivized to produce as much diesel as possible. But US refiners are able to produce a surplus of diesel to meet export demand (see Gulf Coast Diesel Crack Habit), while their European counterparts are unable to meet local demand let alone exports. [ Don’t forget that these product crack spreads only provide a very general indication of refinery profitability because they do not take into account the value of other outputs such as fuel oil.]
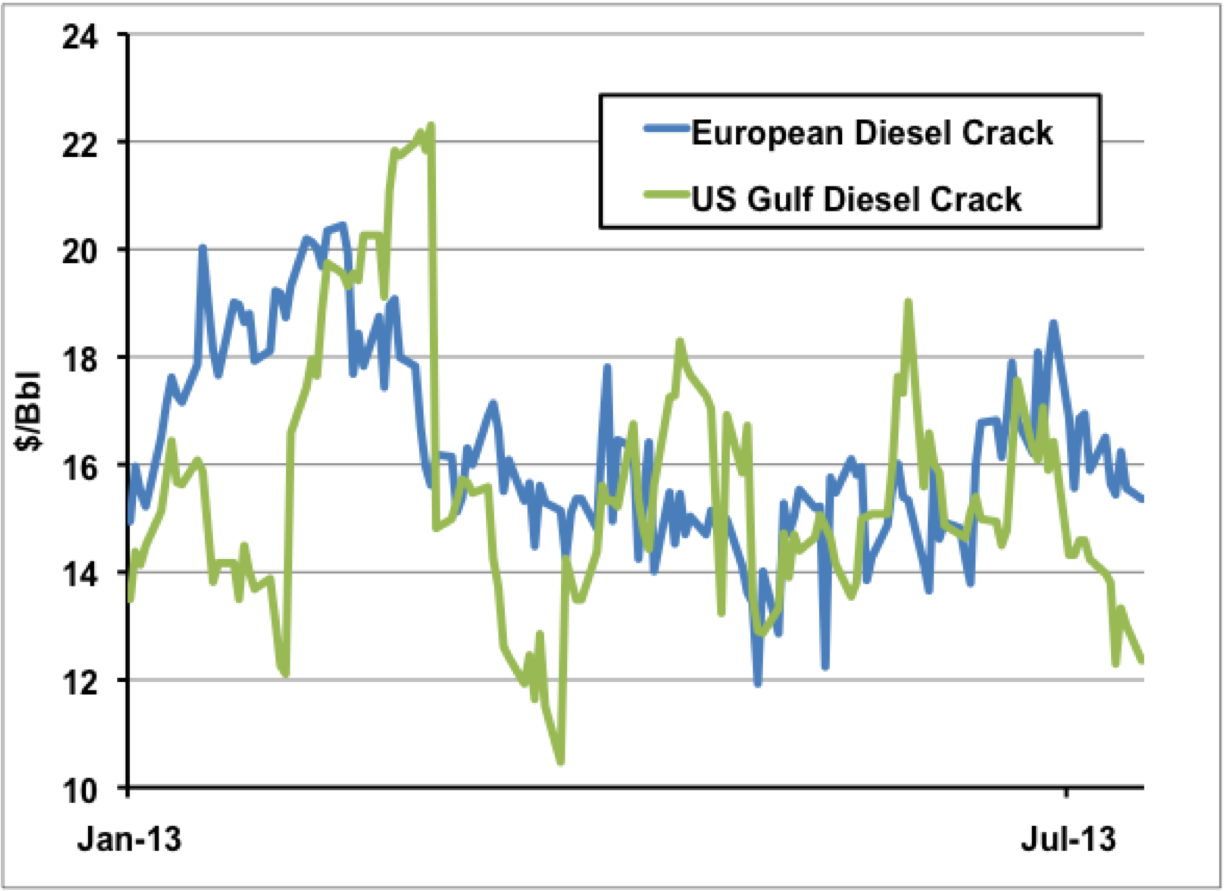
Source: CME Data from Morningstar
Gasoline cracks calculated in the same way against Brent in Europe and LLS in the US Gulf have also performed better in Europe than the US so far this year – averaging $10.6/Bbl in Europe vs. $8.2/Bbl on the US Gulf Coast. In part that reflects higher gasoline prices in Europe because a significant reduction in European refining capacity between 2008 and the end of 2012 has tightened gasoline supplies. IEA data shows that 15 refineries were permanently closed between 2008 and 2013 with a combined capacity of 1.7 MMb/d. And it looks like there may be more closures to come since refinery utilization is still only running at 75 percent this year according to the IEA. Many of the shuttered refineries were older less efficient plants that could not survive reduced product runs and lower refining margins. The lower capacity available to produce gasoline has tightened demand this year but refiners in Europe still have a “surplus” challenge with gasoline because demand is declining faster than refining capacity.
About the song
U2 1987 – Where The Streets Have No Name – Joshua Tree
Comments
Most of U.S. gasoline imports are the BOBs or gasoline blending components. BOBs are CBOB and RBOB which come ready to be blended with ethanol. Last year, the U.S. imported 616 MBPD of gasoline blending components and 55 MBPD of finished gasoline. Approximately half of these volumes came from Europe.
In 2012, the U.S. exported 504 MBPD of gasoline blending components and finished gasoline. We were not a net exporter of gasoline.
In any discussion of U.S. gasoline blending componenets cannot be ignored because it is this form that most gasoline is produced in refineries and moved.
In reply to European Gasoline Exports to U.S. by Paul Klocinski
Paul,
You are correct that I used only the finished gasoline numbers in my analysis. I have now (July 26, 2013) updated the chart and analysis. It does not make a difference to the overall argument that European refiners are sufffering.
Thanks for keeping us on our toes.
Sandy
Taking France as example, the French government after WWII has given a tax break to the diesel versus gasoline. The government wanted to favor the transport industry, because diesel engines are more efficient than gasoline. It also wanted to give the agriculture a cheaper fuel to help automate the crops picking. Until the late 60s passage car engines technology was not able to use diesel. Diesel engine use diesel/air combustion with high compression. Gasoline engine uses a spark plug, small and light passage cars do not require torch, but need RPM. In the 60s gasoline was the passage car engine choice. In the 70s technical advancement in diesel engine technology started to make progress. The price of diesel made it profitable to choose passage cars with diesel engine. Today diesel is the overwhelming choice. This switch to diesel explains why France and Europe produces an oversupply of gasoline. In view of the future electric car and LNG powered transportation industry, I cannot foresee Europe modifying its refineries to produce Diesel. Although Russia is the premier NG importer, Qatari is importing large quantity of LNG, around 20% of the European demand. Aside from north sea NG, the Russian competition is Qatari. This will change with the large NG find in the Eastern Mediterranean sea around Cypress. I happen to spend lots of time in Thailand, and I can attest that more than 60% of the trucking industry in powered with LPG or LNG. The taxi fleets throughout Thailand is more time than not on CNG. My guess is that the passage car fleet is 30% on CNG. Thailand gets the NG from Burma and offshore Thailand. I would not count too much for a diesel market in Thailand or Asian for too long.
Hi
you're right about the troubled outlook for the European refiners, and in particular the degree to which the changes in Russia (slightly less high profile than the USGC changes and the wave of new MidEast mega-refineries) are undercutting the survivors.
But, I think there are a couple of minor errors
first, I think the European ULSD crack numbers in that chart are not quite right, maybe something went wrong with the conversion factors, but cash Rott 10ppm barge cracks vs, say, Dated Brent have spent 2013 in a $15-20/bbl range (we are a net short region after all)
second, it looks like your import chart is just taking finished mogas. Canada would also seem to export just 10k b/d or so to the US nowadays if you take that particular product description. If you look at gasoline blendstocks you'll see that Europe is still sending a decent amount (albeit still much lower, that much is undoubtedly correct) of gasoline-ish stuff transatlantic.
None of that changes the gloom for European refiners, but in both cases it is not quite as bad as those charts would imply
In reply to Hiyou're right about the by john von stackelberg
Thanks for the comment and please also see my reply to Paul's comment above.
I made two errors in my analysis as you point out. The US gasoline imports were much higher than my chart sugested and the diesel crack spread for Europe was far lower than it should have been (used the wrong Bbl/MT conversion factor).
I have made changes to the blog that fixed both these and redrawn the charts. As you said, the argument of the analysis is unchanged - European refineries are in trouble.
Sandy