After a roller coaster over the past year, U.S. LNG feedgas demand has been holding steady at record levels of around 11 Bcf/d for nearly a month now, with the exception of a few days due to pipeline maintenance. With Train 3 at Cheniere Energy’s Corpus Christi Liquefaction facility online and price spreads to global markets favorable for U.S. exports, that’s where it’s likely to stay, except for maintenance periods — at least until new liquefaction trains start commissioning later this year. Two Louisiana projects, Venture Global’s new Calcasieu Pass facility and the sixth train at Cheniere’s existing Sabine Pass terminal, have both indicated that they will begin exporting commissioning cargoes by year’s end — ahead of their originally proposed construction schedules — a prospect that could boost Gulf Coast feedgas demand to even greater heights by the fourth quarter of 2021. In today’s blog, we wrap up this short series with a detailed look at the two projects and implications for LNG feedgas demand this year.
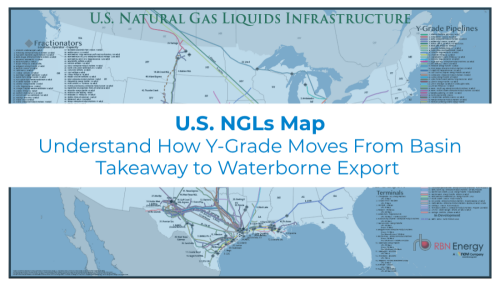
Visualize the infrastructure behind U.S. NGL movement.
The U.S. NGLs Map provides a comprehensive view of the transport, processing, and export networks moving NGLs across the U.S.
In Part 1, we began with an update of the most recent liquefaction capacity addition — Corpus Christi’s Train 3 on March 26 — and its impact on export capacity and feedgas demand, also putting it in the context of the short history of U.S. LNG and, particularly, the incredible volatility of the past year. This time last year, U.S. LNG export cargoes were being cancelled in droves because of poor economics for the first time ever. As cancellations mounted, a large chunk of U.S. LNG production was shut-in, reducing feedgas demand from what were record levels at the time of around 8.5-9 Bcf/d — about or just below levels consistent with full utilization of operating capacity — to less than 3.5 Bcf/d on average over the summer of 2020. While this was transpiring, however, construction on existing projects continued and 10.35 MMtpa (1.4 Bcf/d) of new export capacity was added, primarily along the Gulf Coast. The addition of Corpus Christi Train 3 last month brings the total U.S. LNG export capacity up to 75 MMtpa (9.9 Bcf/d), which equates to about 11 Bcf/d of feedgas demand across the six operational export terminals. We detailed these terminals and their respective capacities in Part 1; we’ve included the map again here in Figure 1 for reference.
About the song
“Such Great Heights” was written by Ben Gibbard and Jimmy Tamborello, and appears as the second song on The Postal Service's debut album, Give Up. Released as the first single in January 2003, the song went to #21 on the Billboard Hot 100 Singles chart. It has been certified Gold by the Recording Industry Association of America (RIAA). Many artists have covered the song, and it has appeared in several television commercials. Personnel on the record were: Ben Gibbard (lead vocals, guitar, keyboards), Jimmy Tamborello (keyboards, synthesizers, electronic drums, programming), and Jen Wood (backing vocals).
Give Up was recorded between 2001 and 2002 at Dying Songs in Los Angeles and Computerworld in Seattle. The album was produced by The Postal Service and released in February 2003. It has remained the only studio album from the partnership of Gibbard and Tamborello. The LP went to #1 on the Billboard Top Dance/Electronic Albums and Heatseekers charts. It also reached #3 on the Billboard Independent Albums chart and #45 on the Billboard Top 200 Albums chart. It has been certified Platinum by the RIAA. Three singles were released from the LP.
The Postal Service was an American indie-pop group from Seattle consisting of singer Ben Gibbard, producer Jimmy Tamborello, and singer Jenny Lewis. Formed in 2001, the band remained inactive from 2005 until 2013, when they reunited for a tour to celebrate the 10th anniversary of the release of their debut and only studio album. Gibbard is the front man of Death Cab for Cutie, and Tamborello (also known as "Dntel") is a musician/producer who is known for his work in glitch music and electronica. The group added Jenny Lewis to provide background vocals. They have released one studio album, one live album, and seven singles. In August 2013, Gibbard announced that the group was disbanding. Gibbard still plays in Death Cab for Cutie and performs in solo projects. Tamborello still performs as Dntel. Jenny Lewis performs as a solo artist.