
A decade ago, the first LNG cargo produced in the Lower 48 was exported from Sabine Pass. Now, the U.S. is home to eight terminals, with seven more under construction, and feedgas demand for LNG has surpassed 20 Bcf/d for the first time. To celebrate this monumental milestone, reached in the past few days, today’s RBN blog looks at how we got here, the recent stall in feedgas volumes, and where U.S. export demand is headed in the years to come.

The Natural Gas Master Class is a one-day online event focusing on understanding flow analysis, interpreting pipeline data and forecasting future flows. This course is designed to equip you with the knowledge and skills to effectively analyze the complexities of natural gas markets, flow analysis, and pipeline modeling. Join us online
October 21 | Online
As U.S. shale gas production climbed in the late 2000s and early 2010s, it became clear that, far from running out of natural gas, the U.S. was heading toward a massive surplus. The abundance of low-cost natural gas spurred significant demand-side investment, driving a buildout of both natural gas-fired power generation and LNG export facilities. On July 31, 2012, Cheniere Energy reached a positive final investment decision (FID) on the first two trains at Sabine Pass LNG (dark-green diamond in Figure 1 below) in Cameron Parish, LA, paving the way for construction of the first LNG export terminal in the Lower 48.

Figure 1. U.S. Operational and FID/Under Construction LNG Export Terminals. Source: Novi Labs
The first train began exporting in 2016 and over the next four years was joined by Cove Point LNG (light-blue diamond in Figure 1), Corpus Christi LNG (dark-blue diamond), Cameron LNG (purple diamond), Freeport LNG (teal diamond) and Elba Island LNG (medium-blue diamond). The sites — all converted from pre-existing LNG import terminals — are generally considered the “first wave of U.S. LNG.” By the beginning of 2020, U.S. LNG export capacity had reached around 7.5 Bcf/d and feedgas demand, which is the amount of gas needed to produce that LNG, was averaging around 8.3 Bcf/d and climbing.
Let’s take a minute to explain feedgas, which we can think of as the demand impact on the U.S. market. In addition to the gas that is liquefied, LNG terminals (with the exception of Freeport LNG) also use gas to power the systems needed to produce that LNG and for behind-the-fence power generation. That usage, combined with losses during liquefaction, means terminals need more gas than is actually turned into LNG. The exact delta varies by terminal, season and the individual specifications at a given site but in general feedgas needs can be more than 10% higher than the export volumes or capacity. Also, while most LNG feedgas is delivered by interstate pipelines, there is some that comes completely via intrastate networks. (Intrastate pipelines are not required to report flow data, so there is a small modeled component in our topline feedgas number to account for these flows. Because of this, not every source tracking overall LNG feedgas may hit this milestone at the same time.)
Daily LNG feedgas demand briefly reached above 9 Bcf/d before cratering because of the impacts of Covid-19 and the global markets crash of 2020. But while feedgas was low, the capacity buildout at the existing terminals was still underway and by the end of 2020 feedgas demand had climbed back above previous records and was over 11 Bcf/d.
In 2022, Venture Global’s Calcasieu Pass LNG (red diamond in Figure 1) became the first fully greenfield export terminal, followed by Plaquemines LNG (light-purple diamond) in 2025. Plaquemines is still technically commissioning, although it has been producing LNG at or even above its nameplate capacity since the end of 2025. Venture Global raised the terminal’s peak capacity during the commissioning when it became clear the trains were capable of producing LNG above the nameplate level. In late 2025, the most recent expansion at Cheniere’s Corpus Christi Terminal, Stage III, also began ramping online, and with these two projects, U.S. feedgas demand soared above 19 Bcf/d, as shown in Figure 2 below.
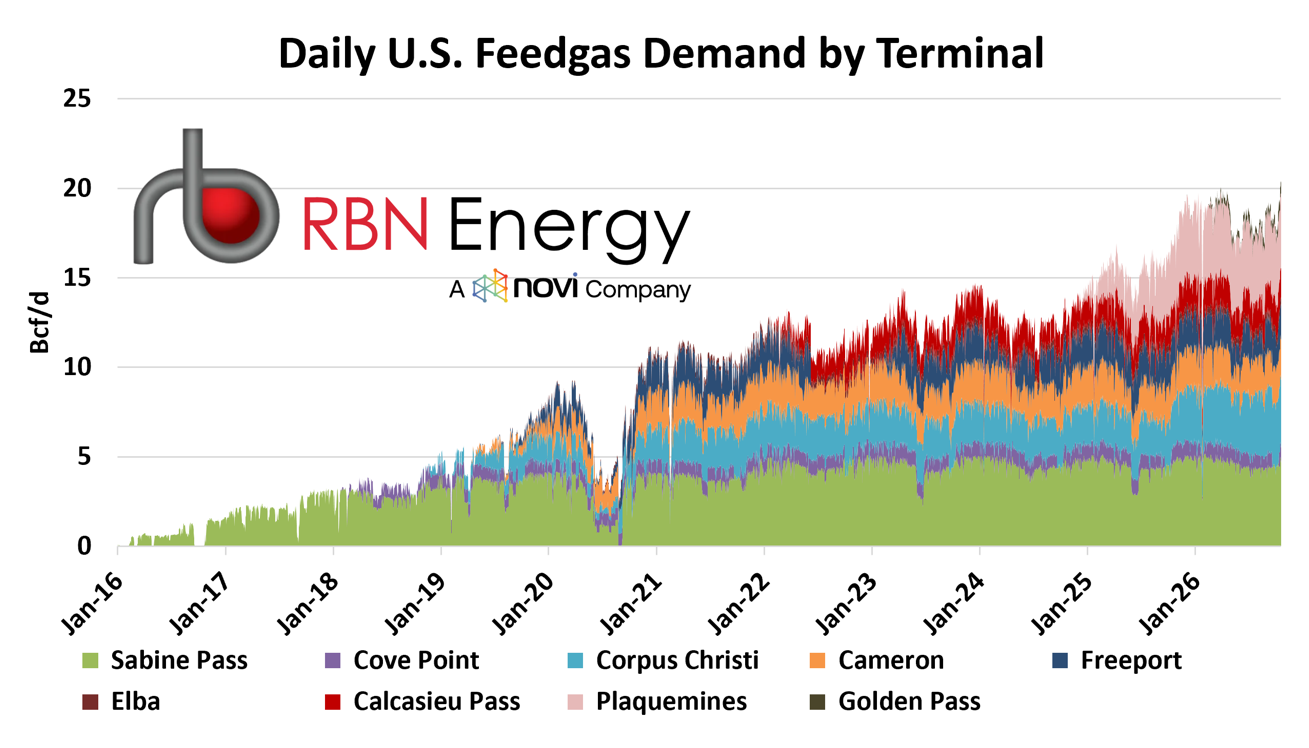
Figure 2. Daily U.S. LNG Feedgas Demand by Terminal. Source: LNG Voyager
Before we talk about what followed last winter and the longer-than-expected road from 19 Bcf/d to 20 Bcf/d, we first need to understand the seasonality of LNG demand. On a surface level, LNG exports have robust, year-round demand. But while it’s not as seasonal as residential or commercial demand, the seasonal swing has become more pronounced as U.S. export capacity has increased.
From an engineering perspective, LNG production is actually more efficient in the winter than in the summer. Essentially, the boosted efficiency allows operators to produce more LNG during the winter and long-term contracts are structured for higher production levels in the winter, which also coincides with the peak demand period in the end markets. LNG terminals also typically perform maintenance in spring or fall, which reduces feedgas intake (and output) compared with winter levels.
RBN's US & Canadian Interior Crude Oil Infrastructure Map features pipelines, refineries, and terminals that are new, existing, and under development from Canada to the Bakken Shale to Cushing.
On top of the contractual lift, many U.S. terminals offer short-term sales, spot cargoes or additional production volumes. Some operators, like Cheniere and Venture Global, market those volumes themselves, while some offer them at a discounted rate to their existing customers. A number of different factors go into this, but in the end every U.S. terminal (except Corpus Christi, which had new capacity ramping online) saw feedgas demand peak at some point between November 2025 and April 2026 before dropping off over the spring.
Let’s use Sabine Pass, the U.S.’s largest terminal, as an example. Its size makes the seasonal differences easy to see. In 2025, Sabine Pass exported just over 4 Bcf/d of LNG (dashed blue line in Figure 3 below), and feedgas demand (dashed green line) averaged just under 4.5 Bcf/d. This is consistent with full operations at the terminal. Excluding June 2025, when the terminal was down for maintenance, feedgas demand averaged 4.3 Bcf/d in spring and summer and 4.75 Bcf/d in the peak months. The delta between feedgas and volumes exported also does not stay consistent throughout the year. Not only is there seasonal variation in the losses but terminals also have LNG storage onsite that can be used to manage a terminal’s contractual obligations and short-lived feedgas disruptions from things like pipeline maintenance or extreme weather events.

Figure 3. Sabine Feedgas & Export Volumes, 2025. Source: LNG Voyager
All else being equal, U.S. feedgas demand follows a similar pattern, but projects ramping online also increase feedgas demand. So far this year, the peak was in April, when feedgas averaged 19.31 Bcf/d for the month. The high number was driven by a combination of lingering winter peak demand and ramping feedgas from commissioning terminals.
May was this year's low point because of maintenance at Cameron LNG (light-green layer in Figure 4 below) and declines elsewhere, with feedgas averaging just 17.31 Bcf/d. Freeport (dark-blue layer) and Cove Point (light-blue layer) also took major maintenance in either the summer or the fall, leaving at least one train offline for much of non-peak season. The exact floor for each terminal varied depending on maintenance schedules and other factors, but in general average feedgas demand was below 18 Bcf/d from May through August and around 18.5 Bcf/d in September (dashed red box). The limited lift from Corpus Christi Stage III’s remaining ramp up (light-blue layer), which was placed fully into service in August, was outweighed by maintenance and lower seasonal demand.
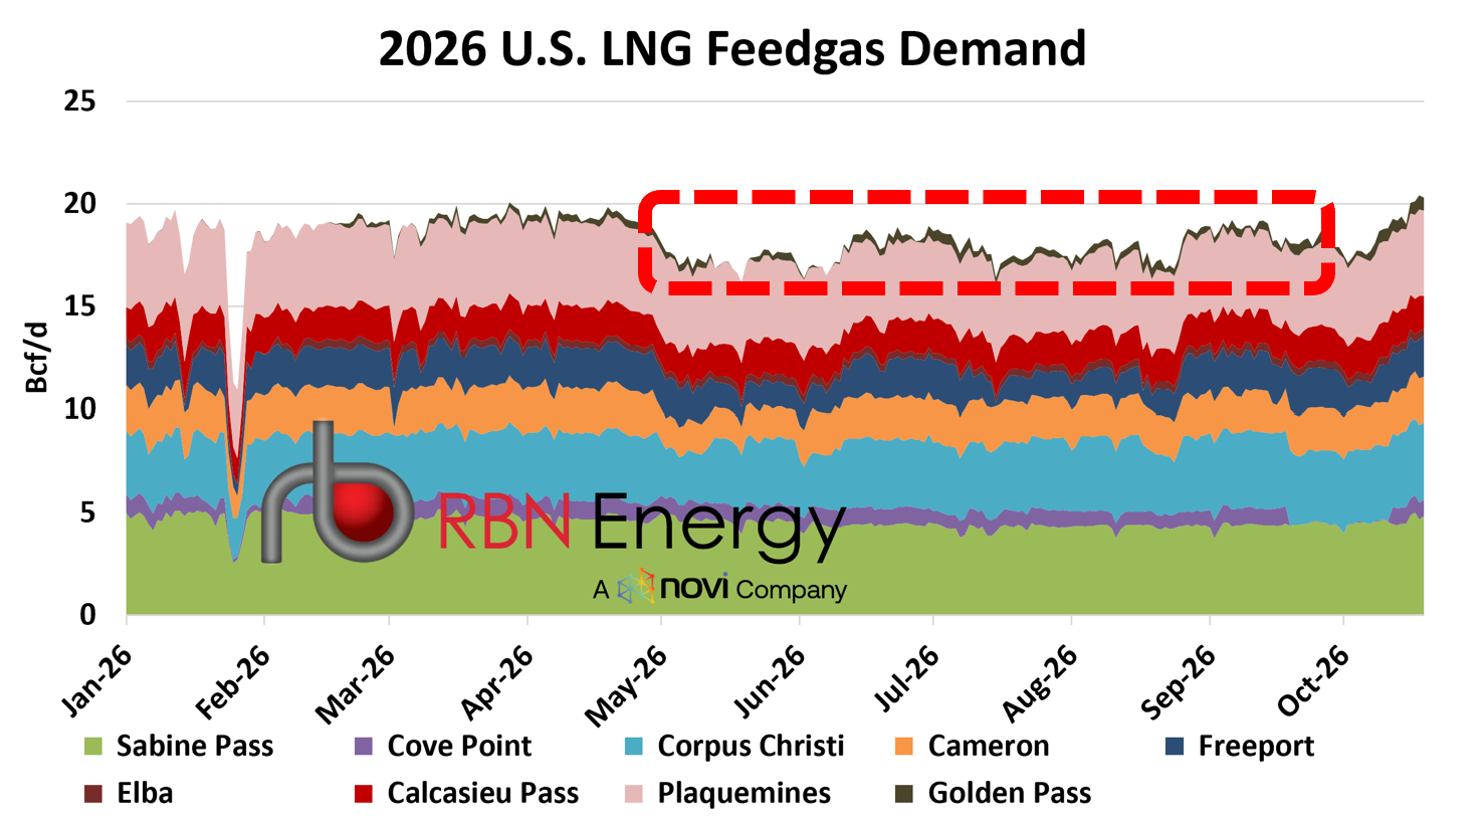
Figure 4. 2026 U.S. Feedgas Demand. Source: LNG Voyager
There is one more terminal that has been a factor in both the ramp up in April and the long wait between 19 Bcf/d and 20 Bcf/d — Golden Pass LNG (dark-green layer at top of Figure 4). Golden Pass is the U.S.’s next export terminal but its path to startup has been anything but smooth. The project’s development started with the first wave of LNG, but stalled out again and again before finally reaching FID in 2019. The project, backed by ExxonMobil and QatarEnergy, will have three liquefaction trains and an export capacity of around 2.1 Bcf/d when complete. However, the project faced a number of construction delays, most notably from the bankruptcy of its former engineering, procurement and construction (EPC) partner, Zachary Holdings, and Train 1 did not begin commissioning until late 2025.
Feedgas demand at the terminal was near zero at the start of this year and then ramped just above 300 MMcf/d by April and exported its first commissioning cargo on April 22 before stalling out. Train 1 will require between 800-850 MMcf/d at full operations. The terminal has exported commissioning cargoes since April, with one or two per month since then. We should note here that when large-scale liquefaction projects ramp online, a train typically produces one to three commissioning cargoes before the EPC contractor hands it over to the terminal operator and it enters full operations. The Golden Pass project’s developers have been tight-lipped about what's happening at the terminal and when they expect Train 1 to enter service. In the meantime, construction on Train 2 has continued and it is expected to achieve mechanical completion at the end of this year and begin ramping online early next year, with Train 3 expected to follow later next year.
Between April and the end of September, feedgas to the commissioning train averaged 300 MMcf/d, with periods when feedgas briefly reached 500 MMcf/d and periods when the terminal took little to no feedgas. While feedgas demand at the terminal continues to be somewhat bumpy, it is trending higher and October has seen record intake days, reaching as high as 690 MMcf/d. The bump up in feedgas from Golden Pass is one of the primary factors behind both reaching 20 Bcf/d and the longer-than-expected road to that milestone.
Beyond Golden Pass coming online, the end of maintenance season and the start of peak demand season have pushed U.S. feedgas demand to new heights. This record is unlikely to hold for very long, as we’re almost certainly heading straight into another record-breaking winter. There is more capacity available this year than last with all of Corpus Christi Stage III and some of Golden Pass operational. On top of that, Europe’s low gas storage inventories and the curtailed production in Qatar from the war in Iran will keep demand for U.S. LNG high during the peak demand period.
Beyond this winter there is even more LNG coming. More trains at Golden Pass, plus three new terminals will all begin ramping online next year. Venture Global pushed forward the timeline for its next project, CP2, and now expects to begin exporting from the terminal in the second half of 2027. Sempra’s Port Arthur LNG (green-and-white diamond in Figure 1) and NextDecade’s Rio Grande LNG (blue-and-white diamond) are also expected to begin commissioning late next year, meaning that 2027 will be another massive year for LNG growth and we still have more record-setting winters ahead of us.
About the song
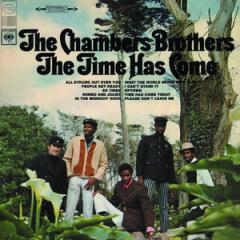
“Time Has Come Today” was written by Joe and Willie Chambers and appears as the fifth song on side two of the Chambers Brothers’ debut album, The Time Has Come. Joe Chambers wrote the lyrics for the song after attending a lecture at UCLA by counterculture philosopher Timothy Leary. The song is a call to action in the fight for social justice during the tumultuous times of the late 1960s. It was originally recorded by the band in 1966, clocking in at a short 2:27 in length. The band re-recorded it in August 1967, with the full-length album version lasting just over 11 minutes. This version features a high hat with tambourine attached and a cowbell as the main percussive instruments in the song. It presents a lysergic whirlwind of sounds that includes heavy use of tape delay and reverb. The midsection of the tune has fuzzed-out guitar that sounds like angry hornets, amid howling and screams, all drenched in tape delay that would have put Sam Phillips on a different astral plane with his experiments with slap-back tape echo at his studio at 706 Union Avenue in Memphis in 1955. Did someone say, “More cowbell?” — well alrighty then ... my soul has been psychedelicized!
Released as a single (at 4:45 running time) in December 1967, it went to #11 on the Billboard Hot 100 Singles chart. The full 11:06 LP version was a staple of progressive FM radio stations in the late 1960s, only rivaled by “In-a-Gadda-Da-Vida” for deejays in need of a bathroom break during airtime. The song has appeared in multiple motion pictures and television shows and has been covered by many artists over the years. Personnel on the record were: Lester Chambers (vocals, percussion, “The Cowbell”), Joe and Willie Chambers (guitars), George Chambers (bass, vocals), and Brian Keenan (drums, percussion).
The Time Has Come LP was recorded in Los Angeles between August 1966 and August 1967, with David Rubinson producing. The album was released in November 1967 and went to #4 on the Billboard 200 Albums chart. It has been certified Gold by the Recording Industry Association of America. Two singles were released from the LP.
The Chambers Brothers are an American psychedelic soul band originally from Carthage, MS — they relocated to Los Angeles in the mid-1950s. They started their career playing folk and gospel music but switched to electric guitars and an edgier rock and soul sound in the Vietnam era. The group in its prime consisted of brothers George, Joe, Lester and Willie Chambers, along with Brian Keenan. They have released seven studio albums, seven live albums, 10 compilation albums and 10 singles. The band still plays occasional shows in the Los Angeles area. Drummer Brian Keenan died in Winsted, CT, in October 1985 at 42. Bassist George Chambers died in Los Angeles in October 2019 at 88. Guitarist Joseph Chambers died in Los Angeles in August 2024 at 81. Vocalist Lester Chambers still occasionally performs live shows on the West Coast, and will be appearing next at the Sweetwater in Mill Valley in November and December. Guitarist Willie Chambers still plays live occasionally, performing with his son, Dylan Chambers, in the band Full Moonalice and was part of the Flower Power Cruise in April 2026.
"About the Song" -- written by Mickey McMahan , RBN Director of Musicology