Audio file
Know When to Hold ’Em – U.S. E&Ps Eschew Capex Increases Despite Oil Price Surge
0:00 / 14:16
Mute

Anyone stepping out of a time machine might conclude that the world has become a giant game of chance, with sports betting ads flooding the airwaves and prediction markets offering wagers on everything from the duration of world leader handshakes to pop culture trivia. Given that the Iran war-driven surge in oil prices doubled E&P profits in Q1 2026, it would seem that the closest thing to a “sure thing” in this marketplace would be a surge in capex to capture fatter cash flows as the political standoff sustains higher realizations. But that would have been a losing bet, as industry 2026 capex remained virtually unchanged. In today’s RBN blog, we review oil and gas producers’ current investment and production guidance while analyzing potential future strategy as the economic impacts of the Iran war evolve.

As shown in Figure 1 below, E&P capital spending (blue bars and left axis) has been trending lower since the post-pandemic peak in 2023. After slashing investment in 2020 and 2021 as the onset of the pandemic threatened the financial stability of a chronically overspending E&P industry, producers rode a wave of sustained high commodity prices in 2022 and 2023 to increase drilling to offset steep shale decline rates. Inflation as well as increased acquisition-related activity helped spur a 58% increase in 2022 and a 24% rise to $64.5 billion in 2023, which resulted in a 14% production gain.

(What can your acreage position tell you about your assets? To learn how the Novi Insights platform can be used to examine operator activity, production performance and infrastructure access, sign up for a free webinar and Q&A session from 2-2:30 pm (Central) on Thursday, June 11, led by Hollee Baird, Novi’s Data & Analytics Technical Advisor. Click here to learn more and to register.)

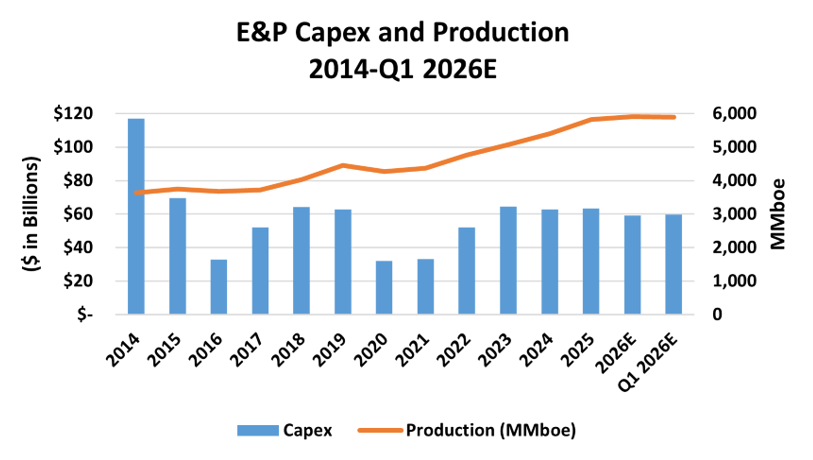
Figure 1. E&P Capex and Production, 2014-Q1 2026E. 
Source: Oil & Gas Financial Analytics LLC

Declining cash flows from lower commodity prices in the latter half of 2023 meant producers couldn’t fund continued capex increases while also sustaining dividends and share buybacks without resuming the deficit spending that had rocked their financial stability a decade before. Maximizing free cash flow was the top priority. Total 2024 investment fell 3% to $62.8 billion and drifted moderately higher to $63.4 billion in 2025. But oil prices continued to fall throughout 2025, leading to five-year-low returns in Q4. E&P managements retained their commitment to financial discipline by slashing its original 2026 capex guidance by 7% to $59.2 billion. After a 7% output increase to 5.8 billion boe in 2025, partially because of the wave of M&A activity, producers forecast output to increase 1% to 5.9 billion boe for the coming year (right end of orange line and right axis).

Then oil prices soared from about $60/bbl in February to nearly $100/bbl in March and hovered around that level as a stalemate in negotiations to end the Iran conflict and the continued closure of the Strait of Hormuz disrupted the global oil trade. Just one month of higher prices spurred a 25% increase in Q1 2026 realizations for the companies we cover and the continuing impact of the disruption offered the prospect of even fatter cash flows in Q2 2026. The urgent issue for E&P managements was the decision to loosen the reins on very tight capital investment to boost production to garner even higher returns. The pain inflicted on consumers by much higher fuel prices, especially gasoline, diesel and jet fuel, added some level of urgency to the decisions as political pressure rose.

But producers overwhelmingly chose to stand pat. Remarkably, 31 of the 36 companies we cover left their 2026 capital investment guidance unchanged as total projected spending increased by less than 1% to $59.7 billion. That’s 7% below the post-pandemic peak in 2023 and 10% lower than the average $66.3 billion annual investment in 2014-19. Capex guidance for the Oil-Weighted peer group, the companies most likely to benefit from higher prices, rose just 2%, while investment forecasts for the Diversified and Gas-Weighted companies were unchanged. The total 2026 production forecast for our universe held steady at 5.9 billion boe, just 1% higher than 2025.

The steadfast guidance spoke volumes about the industry’s deep reluctance to abandon the commitment to financial discipline that triggered its resurgence after investors virtually abandoned the sector in 2015-20. In Q1 conference calls, the companies — with one notable exception we’ll discuss below — continued to emphasize their long-term focus on lowering costs and increasing efficiencies to sustain shareholder returns and expressed reluctance to alter their long-term strategy without clear evidence that the current higher price deck would be sustained over the long term. After outspending cash flow for decades, U.S. producers retreated to a reinvestment rate of just 60% of cash flow in 2023-25.

Figure 2. E&P capex per unit of Production, 2014-Q1 2026E. 
Source: Oil & Gas Financial Analytics LLC

More tellingly, as shown in Figure 2 above, the criteria for allocating E&P exploration and development capital spending has changed. Pre-pandemic capex per boe of production (blue line and left axis) rose and retreated with changes in the WTI oil price (orange layer and right axis). Post-pandemic, the ratio steadied at a much lower rate of approximately $10/boe of production as the goal shifted to long-term sustaining of breakeven pricing in the $50/boe range. This supports current levels of profitability and shareholder returns that are crucial to maintaining investor support.

Let’s look at investment trends by peer group.

Oil-Weighted E&Ps

In their Q1 earnings releases, the 11 Oil-Weighted companies in our universe guided to total 2026 capital expenditures of $28.9 billion. As shown in Figure 3 below, estimated Q1 2026 investment (far-right blue bar and left axis) is 2%, or $600 million, higher than initial 2026 guidance but 7% lower than the $31.3 billion invested in 2025. The overall production guidance was unchanged from the initial 2.4 billion boe announced with year-end 2025 results, which was flat with 2025 actual output. 

Figure 3. Oil-Weighted E&Ps Capex and Production, 2014-Q1 2026E. 
Source: Oil & Gas Financial Analytics LLC

As shown in Figure 4 below, capital spending per boe of production ranged from $9/boe to $17/boe. Major Permian producers such as Diamondback Energy (FANG), Occidental Petroleum (OXY) and Devon Energy (DVN) were near the lower end of the cost spectrum, while Gulf producer Talos Energy (TALO) had the highest cost.

Figure 4. Capex Per Unit of Production, Oil-Weighted E&Ps. 
Source: Oil & Gas Financial Analytics LLC

Diamondback and ConocoPhillips (COP) were responsible for the lion’s share of the increase capital guidance in this peer group. Diamondback was the only U.S. E&P we cover that explicitly said it was increasing drilling-and-completion activity to take advantage of higher oil prices and tight global supply. The company is adding two or three rigs and a frac crew with a modest $150 million, or 4%, increase in capital spending. It also lifted production guidance by 5%, framing the move as a disciplined, price‑responsive strategy focused largely on bringing online some of its inventory of drilled uncompleted wells (DUCs) rather than a permanent shift toward growth. ConocoPhillips upped its guidance by 2%, or $250 million, to add a Permian rig to keep up with faster completion efficiencies and changes in the timing of major international projects. The company slightly lowered its 2026 production guidance on disruptions caused by the conflict in the Middle East.

Diversified Peer Group

All 15 companies in the Diversified peer group left their initial 2026 capital spending guidance unchanged at $19.2 billion (far-right blue bar and left axis in Figure 5). This year’s investment is a significant 9% lower than the $21 billion allocated in 2025. Production (right end of orange line and right axis) was also unchanged at 1.52 billion boe.

Figure 5. Diversified E&Ps Capex and Production, 2014-Q1 2026E. 
Source: Oil & Gas Financial Analytics LLC

Figure 6 below shows a wider range of capital spending per boe for the Diversified Peer Group than for the Oil-Weighted companies. The four producers that account for two-thirds of the total investment, EOG Resources (EOG; $5.7 billion), SM Energy (SM; $2.4 billion), Ovintiv (OVV; $2.3 billion) and APA Corp. (APA; $2.1 billion) have relatively high liquids weightings and are clustered in the $10-$15 per boe range. Although EOG’s total budget is unchanged, the company announced it was shifting the allocation within its portfolio from the dry gas Dorado play in South Texas to add five net completions in the Delaware Basin and 10 net completions in the Ohio Utica play. The result is slight upticks in its oil and NGL production guidance.

What Can Your Acreage Position Tell You About Your Assets?

Examining operator activity, production performance, and infrastructure access through Shapefile Filtering in Novi Insights.

June 11, 2026
02:00 PM to 02:30 PM (CT)

Figure 6. Capex Per Unit of Production, Diversified E&Ps. 
Source: Oil & Gas Financial Analytics LLC

The relatively high ratio for Infinity Natural Resources (INR) reflects accelerated spending following the February close of its transformative $1.2 billion acquisition from Antero Resources. Steady acquisition activity by non-operated asset focused Northern Oil & Gas (NOG) and Granite Ridge Natural Resources (GRNT) reflects higher investment that is expected to produce 5%-6% output growth this year.

Gas-Weighted E&Ps

All 10 Gas-Weighted producers left their initial 2026 investment guidance unchanged. The total capex of $11.6 billion (far-right blue bar and left axis) represents a 4% increase over 2025, reflecting last year’s higher gas prices. Also unchanged is a 3% increase in production to 1.97 billion boe (right end of orange line and right axis). 

Figure 7. Gas-Weighted E&Ps Capex and Production, 2014-Q1 2026E. 
Source: Oil & Gas Financial Analytics LLC

As shown in Figure 8 below, the tight range of capex per boe for most of the peer group reflects the tight rein on investment producers instituted to maximize free cash flows with very weak gas pricing over most of the post-pandemic period. While geopolitical turmoil has clouded the outlook for crude realizations, increased LNG exports, higher industrial demand, and data center development have resulted in an optimistic outlook for long-term natural gas pricing. However, almost all gas companies are still investing conservatively. 

Figure 8. Capex Per Unit of Production, Gas-Weighted E&Ps. 
Source: Oil & Gas Financial Analytics LLC

The notable outlier is Comstock Resources (CRK). The company, which is controlled by majority stockholder Jerry Jones, drastically slashed capital spending, shut-in wells and eliminated its dividend in response to very weak Haynesville gas pricing in 2023-24. However, rising prices triggered a 37% increase in the company’s capital investment in 2026 to rapidly accelerate development in the Western Haynesville, which will eventually translate to higher output.

Looking Forward

Crude prices have remained elevated on the continued stalemate in the Middle East. Although no producers have formally announced higher capex guidance, rig counts have been rising. According to Baker Hughes, 10 oil-directed rigs were added in the week ended May 22, the largest increase in four years. On the other hand, logistical obstacles to increasing production include the current near-100% utilization of frac fleets. Meanwhile, Appalachian gas prices have collapsed in Q2 2026 after a robust Q1 2026, which should keep Gas-Weighted E&Ps from raising capex guidance. We will continue to monitor spending trends, including changes when E&Ps release their Q2 2026 reports this summer.

About the song

“The Gambler” was written by Don Schlitz and appears as the first song on Kenny Rogers’ sixth studio album of the same name. Schlitz wrote the song in 1976 while working as a night shift computer operator in Nashville. The song uses a poker game as a metaphor for overcoming life’s challenges. Its catchy chorus — “You got to know when to hold ’em, and know when to fold ’em” — helped propel the song to become an international hit. It was first recorded by Bobby Bare in 1978 and appeared on his Bare album, but was never released as a single. Kenny Rogers released it as a single in November 1978 and it went to #1 on the Billboard Hot Country and #16 on the Billboard Hot 100 Singles charts. Many artists have covered the song over the years. Rogers won a Grammy Award for Best Male Country Vocal Performance for the song in 1980. Personnel on the record were: Kenny Rogers (lead vocals), The Jordanaires, Dottie West (backing vocals), Ray Edenton, Jimmy Capps (acoustic guitar), Billy Sandford (electric guitar), Pete Drake (steel guitar), Pig Robbins (piano), Bob Moore (acoustic bass), Tommy Allsup (tic-tac bass), and Jerry Carringan (drums, shakers). 

The album, The Gambler, was recorded at Jack Clement Recording in Nashville in the summer of 1978. Produced by Larry Butler, it was released in November 1978 and went to #1 on the Billboard Top Country, and #12 on the Billboard 200 Albums charts. It has been certified 5X Platinum by the Recording Industry Association of America. Two singles were released from the LP. A television movie, Kenny Rogers as the Gambler, was released in 1980. It was directed by Dick Lowry and starred Kenny Rogers as Brady Hawkes, the gambler.

Kenny Rogers was an American singer, songwriter, musician and actor. He began his professional career as a musician in Houston, playing rock and roll in the club circuit in the late 1950s before joining the New Christy Minstrels as a singing bassist in 1966. He left them to form The First Edition, which had their first hit record in 1968 with the psychedelic “Just Dropped In to See What Condition My Condition Was In.” Rogers charted more than 120 songs in different genres and sold more than 100 million records worldwide. As a solo artist, he released 39 studio albums, 43 compilation albums and 80 singles. He was featured in four motion pictures and made numerous television appearances. He won a Grammy Award, an ACM Honor Award, an ASCAP Golden Note Award, several ACM and CMA Awards, has a star on the Hollywood Walk of Fame, and is a member of the Country Music Hall of Fame. He played his last concert in Nashville in October 2017 and died in Sandy Springs, GA, in March 2020 at 81.

Music URL

"About the Song" -- written by Mickey McMahan , RBN Director of Musicology