The natural gas supply demand story has been dominated all year by the record storage overhang from 2011 and whether 2012 gas storage injections could continue until October or November without hitting the wall - i.e. completely filling storage capacity. In today’s blog we review the BENTEK supply demand numbers and then investigate power burn indicators - uncovering a close shave in the coal-to-gas fuel-switching window.
Supply/Demand
The last time we provided an update based on BENTEK’s supply/demand numbers was in early June (see “Dodge The Bullet – NG Supply Overhang Correcting”). Back then the natural gas power burn “sensation” was riding high and keeping the storage wall naysayers’ necks wound in. Natural gas NYMEX prices were under $2.50/MMbtu and production for the year to June had been basically flat.
Source: BENTEK
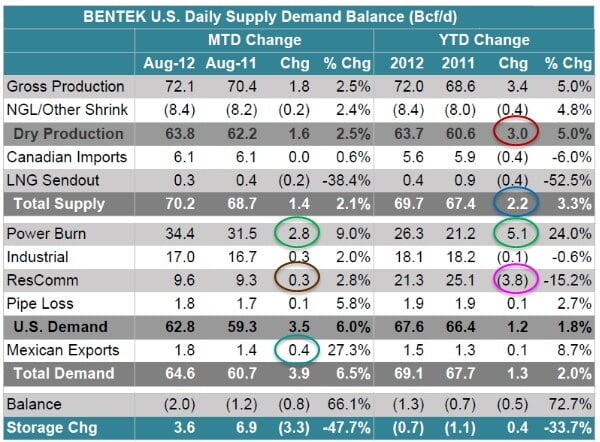
As we noted on Monday of this week (see “Natural Gas Rig Count, Production and Productivity – Kinda Spooky”) flat production has continued all summer. Bentek’s data (see table above) shows total dry gas production increasing by 3.0 bcf/d so far this year over 2011(red circle) but reductions in Canadian imports and LNG send out bring the total increase in year-on-year supply down to 2.2 bcf/d (blue circle).
The power burn sensation continues to dominate the demand picture. Power burn shows a 2.8 bcf/d increase so far this month versus last August and a year-to-date increase of a whopping 5 bcf/d (green circles). The non-winter of 2011/2012 left year-to-date residential and commercial (ResComm) demand (heating and cooking) number down 3.8 bcf/d (magenta circle) versus 2011 – a shortfall that on its own counters a significant chunk of the 5 bcf/d benefit from increased power burn. ResComm is slightly higher this month compared to last August (0.3 bcf/d increase – brown circle). Industrial demand is up slightly this August versus last (0.3bcf/d increase) but flat for the year-to-date versus last year.
An additional 0.4 bcf/d (light blue circle) of gas is being exported to Mexico this month versus last August. U.S. exports to Mexico have grown since 2011 (up 8.7 percent so far this year) as Mexican domestic natural gas production declines and their natural gas power burn increases. Abundant US supplies at low prices are attractive to Mexico. With pipeline capacity to Mexico of at least 3.0 bcf/d there is room to increase exports from their current 1.8 bcf/d level. Recent press reports (example here) about a $3 Billion natural gas pipeline network in northern Mexico indicate this may be the tip of the iceberg.
The increase in Mexican exports and the power burn sensation together overcame the ResComm decline to leave overall demand up 1.3 bcf/d for the year. Perhaps more importantly the August 3.9 bcf/d demand increase left storage injections down this month by 3.3 bcf/d versus last year - keeping market prices close to $3/MMbtu this summer by chipping away at the overall storage surplus.
Power Burn Sensation
Will the power burn sensation continue? To find out we looked at two indicators that underpin power burn economics. The first is cooling degree days (CDDs). We explained how degree days are calculated previously (see Under the Weather – Cooling Degree Days, Natural Gas Storage and Price ). CDDs correlate closely with air conditioning use and tell us pretty reliably when power demand is higher than usual because it is hot in populated areas. The chart below shows CDDs this summer (blue line) and the deviation between this summer and the 30-year normal (red line). Even if you haven’t stepped out of an air-conditioned environment this summer you probably at least saw on TV that we just finished up the hottest July on record. It’s no surprise therefore to see CDDs crossing 100 in the first week of July. During July and August CDDs stayed well above normal as the country experienced exceptional heat. High levels of CDDs indicate that power generation is running at peak levels. That means that both gas and coal are burned as system operators struggle to meet air conditioning demand by using all available
capacity. So that explains the power burn this summer but can the sensation continue once temperatures fall?